Optical Crosstalk in CMOS Image Sensors
Chris Fesenmaier and Benjamin Sheahan
Psych 221 - Winter 2006-2007
| Welcome | ||
| Introduction | ||
| Methods | ||
| Pixel Scaling | ||
| Methods | ||
| Results | ||
| Conclusions | ||
| References | ||
| Crosstalk Reduction | ||
| Methods | ||
| Air Gaps | ||
| Light Guide | ||
| Metal Mirrors | ||
| Results | ||
| Reference | ||
| Air Gaps | ||
| Light Guide | ||
| Metal Mirrors | ||
| Conclusions | ||
| References | ||
| Appendices | ||
Pixel Scaling - Results
The input power to the pixel was 1 watt per square cm for each simulation. The received power for the Blue, Green and Red color filters as a function of Pixel Pitch is shown in Figure 7.
Figure 7: The blue dashed line is the optical power that is received by the entire pixel and the solid line is the power received by the central region of the pixel with a blue color filter.
The received optical power decreases significantly as the pixel is scaled. The ability of the micro lens to focus the optical power at the center of the pixel degrades as the pixel pitch is decreased as shown by the larger decrease in the optical power received in the active region (50%) of the pixel.
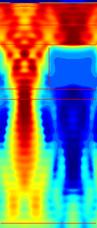
Figure 8: 0.97um Pixel
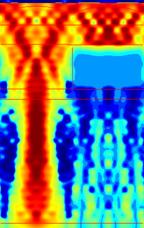
Figure 9: 1.45um pixel
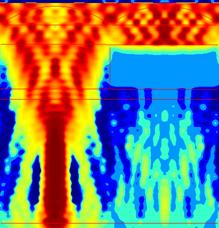
Figure 10: 2.2um Pixel
Figures 8, 9, and 10 show the optical power (Poynting Vector) flow through the 0.97um, the 1.45um and 2.20um pixel using he blue color filter.
Figure 11: The dashed line is the received Optical power for the entire (100%) of the pixel and the solid line is the optical power for the Active central region (50%) using the green color filter.
The green color filter performs better than the blue color filter and optical transmission is significantly higher than for the blue color filter. The received optical power for the 0.97um pixel is degraded compared to the 2.2um and 1.45um pixels and is especially degraded for the 50% active area (dashed green line). The optical power simulations at 555nm and green color filter are shown in figure 12, 13 and 14.
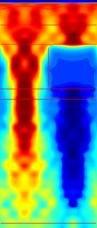
Figure 12: 555nm Green 0.97 Simulation
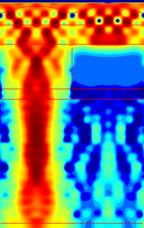
Figure 13: 555nm Green 1.45 Pixel Simulation
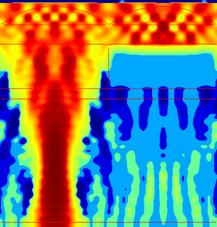
Figure 14: 555nm Green 2.20um Pixel Simulation
Figure 15: The red dashed line is the received Optical power over the entire pixel and the solid line is the power received over the active area (50%) at 650nm and red color filter.
The red color filter has the lowest loss and the received optical power is greater than that for the Green or Blue color filter. The trend of severe degradation of the received optical power as the pixel pitch is decreased is similar to that for the Green and Blue pixels.
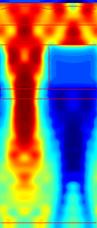
Figure 17: 650nm Red 0.97um pixel Simulation
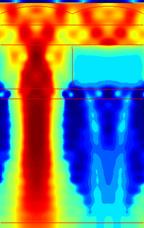
Figure 18: 650nm Red 1.45um pixel simulation
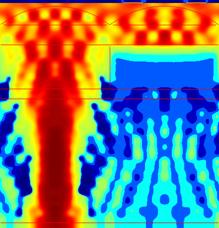
Figure 19: 650nm Red 2.2um pixel simulation
The Spectral Crosstalk is dominated by the color filter and is minimally affected by pixel scaling as shown in figure 20.
Figure 20: Spectral Crosstalk as a function of pixel pitch
The Spatial (Optical) Crosstalk increases dramatically as the pixel pitch is decreased from 1.45um to 0.97um. This is shown in figure 21.
Figure 21: Spatial crosstalk versus pixel pitch.