[
Main ] [ Outline ] [ Introduction
] [ MRI
Basics ] [ Cross-Relaxometry ] [ Results ] [ References
] [ Appendix
]
Results and Discussion
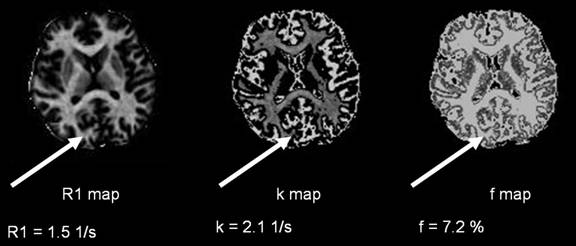
We ran the simulations and obtained the R1, k and f values for a
single axial slice of the brain. The R1, k and f maps are shown below:
Even though our values are in the correct ballpark, it is difficult
to say whether our method works properly until we do a comprehensive fitting of
the entire brain, and see whether our values are consistent with the values
from the Yarnykh paper.
We would need to pay special attention to the values in the visual
cortex, and see if we can outline the line of Gennari,
as getting consistent k, f and R values for that region would be a good
indicator that our method works, and would provide a quantitative method of
localizing the visual cortex. It will probably be easier to localize the line
of Gennari on coronal slices of the brain, but once
we have a fully segmented brain, doing the analysis on coronal slices is easy.
One noticeable discrepancy in our method is the presence of
negative values in some of our estimates, but those values usually appear at
the locations of the CSF (the dark area in the f map), so it might be that our
approximations do not hold in this region. Also, in a few of our non-linear
fits we got poorly conditioned matrices, but we attribute that to errors in our
data acquisition.
Future Work
In order to make
sure that the visual cortex is properly localized using our cross-relaxation
technique; we would need to acquire our data on volunteers whose visual cortex
has already been mapped using fMRI. If our k, f and
R1 maps are consistent over the V1 locations of the volunteers, that will show
that we have a quantitative method of localizing the visual cortex that does
not depend on applying a visual stimulus.