[
Main ] [ Outline ] [ Introduction
] [ MRI
Basics ] [ Cross-Relaxometry ] [ Results ] [ References
] [ Appendix
]
Abstract
With this project, we intend to quantitatively characterize and
localize the human primary visual cortex. The primary technique that was used
in our analyses was Magnetic Resonance Imaging (MRI). We will first give a brief
overview of why current MRI techniques are inadequate for quantitative
parameterization. We will then go over some of the basics of MRI to set a
platform for the actual method that we used to derive our results,
Cross-Relaxometry. Finally, we will present how our results were able to give
quantitative parameters that were characteristic of the human visual cortex.
Motivation
This project tries to put quantitative parameters with absolute
units on the human visual cortex. Currently, this type of parameterization has
been performed using the available Magnetic Resonance Imaging (MRI) techniques.
However, the conventional algorithms employed until now have not been able to
put absolute units on the parameters that are characteristic of the different parts
of the brain. This project tries to experimentally demonstrate the results of a
recently published paper [1] that highlights a sequence which provides
quantitative parameters with absolute units. These parameters are distinct for
the different parts of the brain and hence can be used to get an enhanced
localization of the primary visual cortex.
Primary Visual Cortex
The primary visual cortex (also known as the Striate Cortex or V1)
lies at the back of the brain and is responsible for processing visual stimuli.
It does so when the neurons in the cortex fire action potentials (electric
signals) as the stimuli appear within their receptive fields. The receptive
fields represent a small region within the entire visual field of the
individual. The photoreceptors in the retina pick up the photons that enter the
eye, transform them into electric signals, and the optic nerve carries these
signals through the lateral geniculate nucleus (LGN)
to the visual cortex. The signals that come to the visual cortex actually end
at the line of Gennari that borders the cortex and
acts as the input to the cortex. From there, V1 then acts as the major
distributor of all visual information that reaches the cortical areas [2].
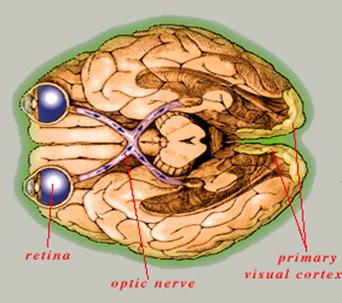
Figure
1. Outline showing the pathway of electric
signals on the optic nerve to the visual cortex.
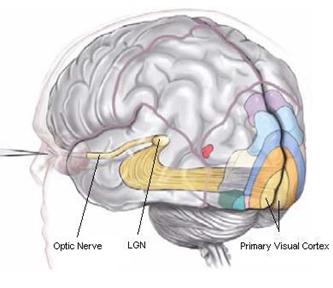
Figure
2. Picture of the brain
showing the primary visual cortex, the lateral geniculate
nucleus (LGN), and the optic nerve.
Line of Gennari
The line of Gennari (Figure 3) is a band
of highly myelinated fibers in the cortical layer
that borders the visual cortex. It is also what gives the striate cortex its
name. The line of Gennari fibers act as an input to
the visual cortex from the LGN. The borders of the visual cortex can be
identified by seeing the areas where the line of Gennari
disappears [3].
Note: Myelin is a fatty substance that covers the neuron fibers,
protecting the neurons and helping in the fast transmission of electric signals
along them. It also constitutes the well-known White Matter in the brain.
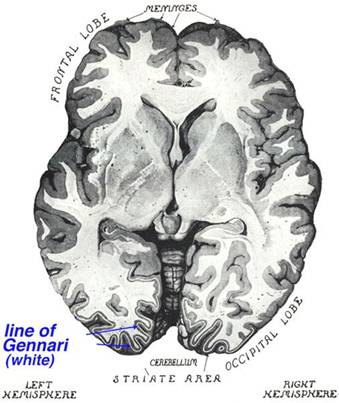
Figure
3. Horizontal section of
the brain showing the line of Gennari in the striate
cortex (primary visual cortex). From Polyzak (1957).
Magnetic Resonance Imaging
The basis for our project’s quantitative analyses was formed by
Magnetic Resonance Imaging (MRI). MRI is used mainly in clinical and scientific
studies to obtain high quality images of the brain and other parts of the body.
There are two types of MRI scans that are mainly used for brain
scans:
Structural MRI
Structural MRI deals with information about tissue contrast. For
example, in the brain, it helps distinguish between gray matter and white
matter. Even though the structural MRI scan gives quantitative values for the
different intensities observed, they are too close to distinguish
sometimes. Thus if we look at the scan below in Figure 4, we have no positive
way to identify the visual cortex or the Line of Gennari
in this image. We can make a good guesstimate but cannot quantify it with any
values.
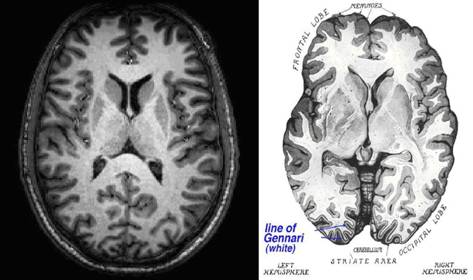
(a) (b)
Figure
4. (a) Horizontal structural MRI scan of the
brain. (b) Horizontal anatomical image of the brain showing the line of Gennari. It can be seen that (a) does not provide enough
information to locate the line of Gennari in the
scan.
Functional MRI (fMRI)
The functional MRI deals with determining which parts of the brain
are activated by some physical or sensory stimulus. The stimulus can be applied
easily while the person is lying in the scanner.
The scans obtained using fMRI are more
informative since they can give a nice visual of the part that has been
activated using the stimulus. For example, in Figure 5 we can see the yellow
and red dots show visual cortex activity. It can be seen that the fMRI scan helps us to better localize the part of the brain
in question. However, it suffers from the same fault as the structural case. fMRI does not work with units and
hence it is not easy to quantify the different parameters of the brain.
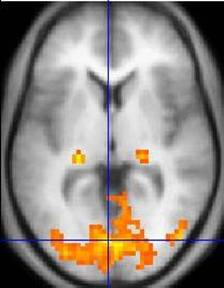
Figure
5. An fMRI
scan showing regions of activation, including the primary visual cortex.
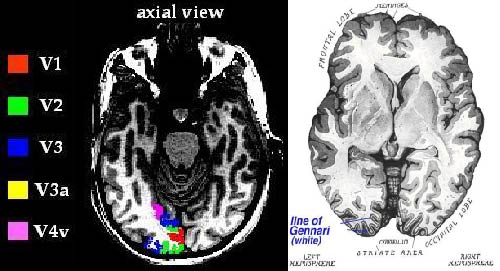
(a) (b)
Figure
6. (a) A sophisticated fMRI
scan outlining the primary visual cortex (V1) and other cortical regions (V2,
V3, V4). (b) Horizontal anatomical image of the brain showing the line of Gennari. An image as that produced in (a) only gives
relative values and hence it is not possible to quantitatively characterize the
location of the visual cortex.
Project Proposal
As was outlined above, the line of Gennari
borders the visual cortex. The line of Gennari as
mentioned before is a highly myelinated band of
fibers and if we are able to identify quantifiable methods which would outline
this highly myelinated area and put absolute units on
the values, we would have a successful localization of the visual cortex.
Hence, the project proposes to find a quantitative method that
would produce certain parameters (called k and f parameters) that would be
characteristic of the human visual cortex. The advantage here is that these
parameters have different values in absolute units for different parts of the
brain. Using these parameters, we should be able convincingly determine the
location of the visual cortex.
Possible Applications
The method would have wide clinical and scientific applicability.
It can be used to do an enhanced diagnosis of brain and white matter related
diseases such as multiple sclerosis. This method would be able to
quantitatively identify the affected areas and allow doctors to recommend
better treatments that would be extremely localized and hence more effective.
Another application of this would be the quantitative parameterization
of the visual cortex in blind individuals. In these individuals, it can hard to
get fMRI data as was shown before since it would hard
to activate the visual cortex area by giving them any visual stimulus. Hence,
localization using fMRI techniques would not be very
useful in these individuals. However, with this method would help solve this
problem.