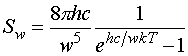
The sources were modeled as blackbody radiators. The energy generated per unit volume at each unit wavelength from the heating of the filament can be modeled as blackbody radiation, with the curve corresponding to the temperature of the filament, given as follows:
where w is the wavelength and Sw is the energy per unit volume per unit wavelength. The picture below shows how tungsten will progressively change color as it is heated:
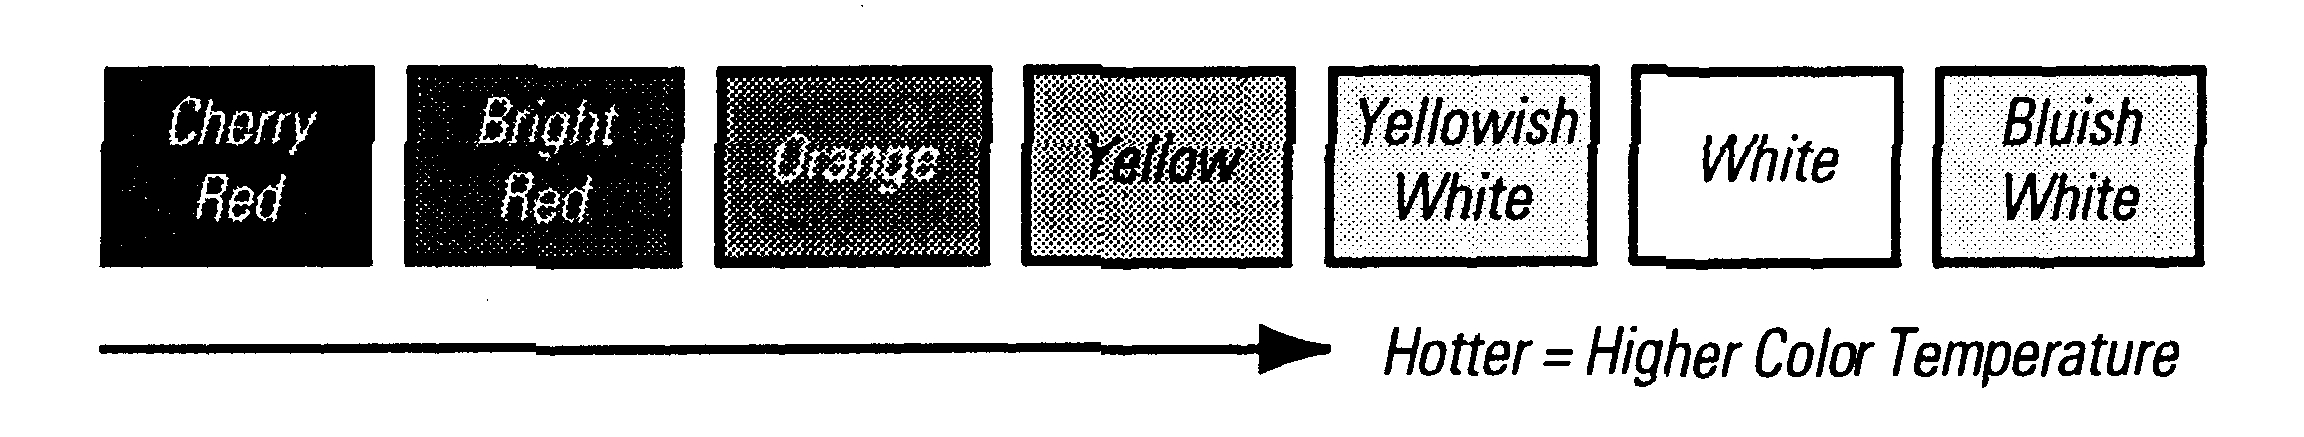
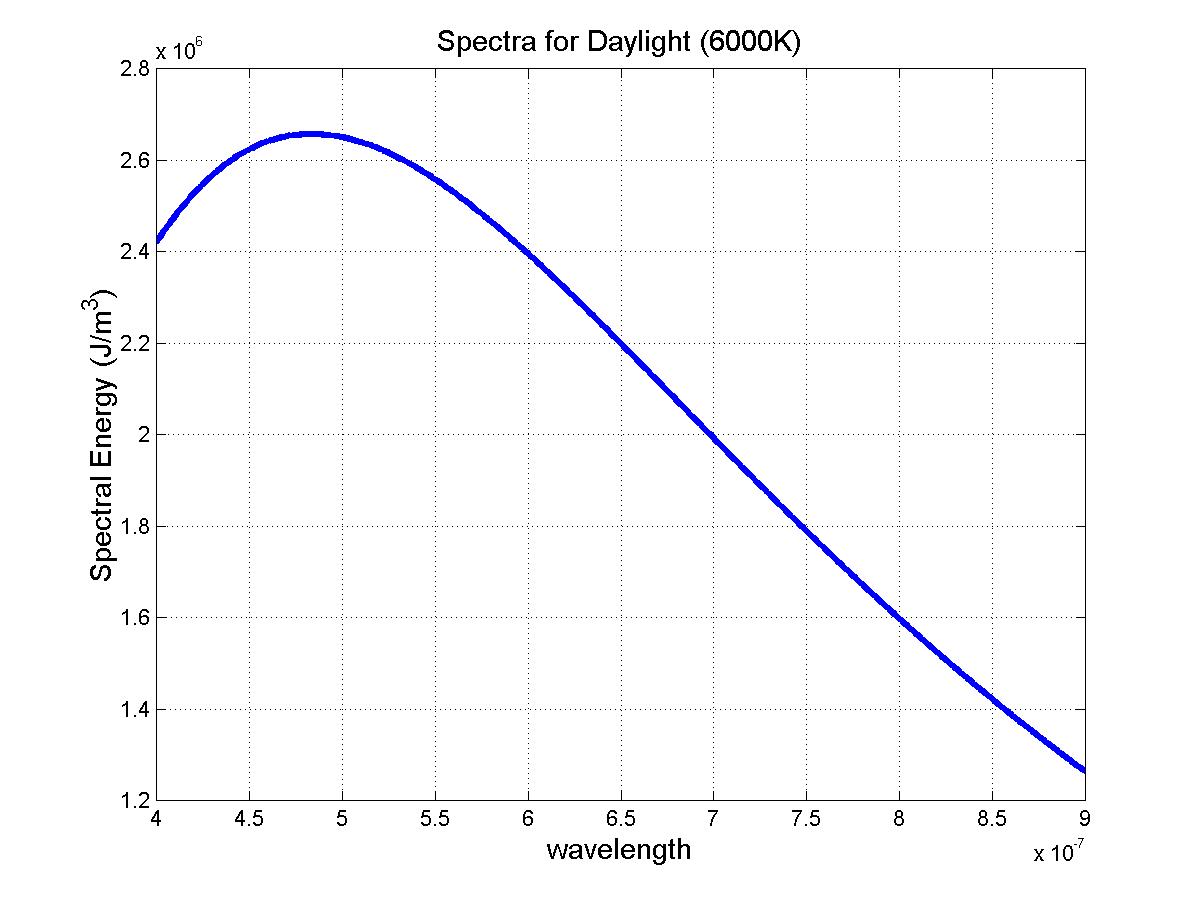
The standard incandescent bulb has the tungsten filament heated to approximately 2700 degrees Kelvin, corresponding to a light that is yellowish-white, or a strong spectral component around 500nm. With a Halogen bulb, the temperature is raised to closer to 4000 Kelvin, corresponding to white light without the strong yellow component, and a strong blue component. The typical daylight entering a window on a sunny day is at 6000 Kelvin, and is significantly bluer or "cooler" than the light of incandescent lamps.
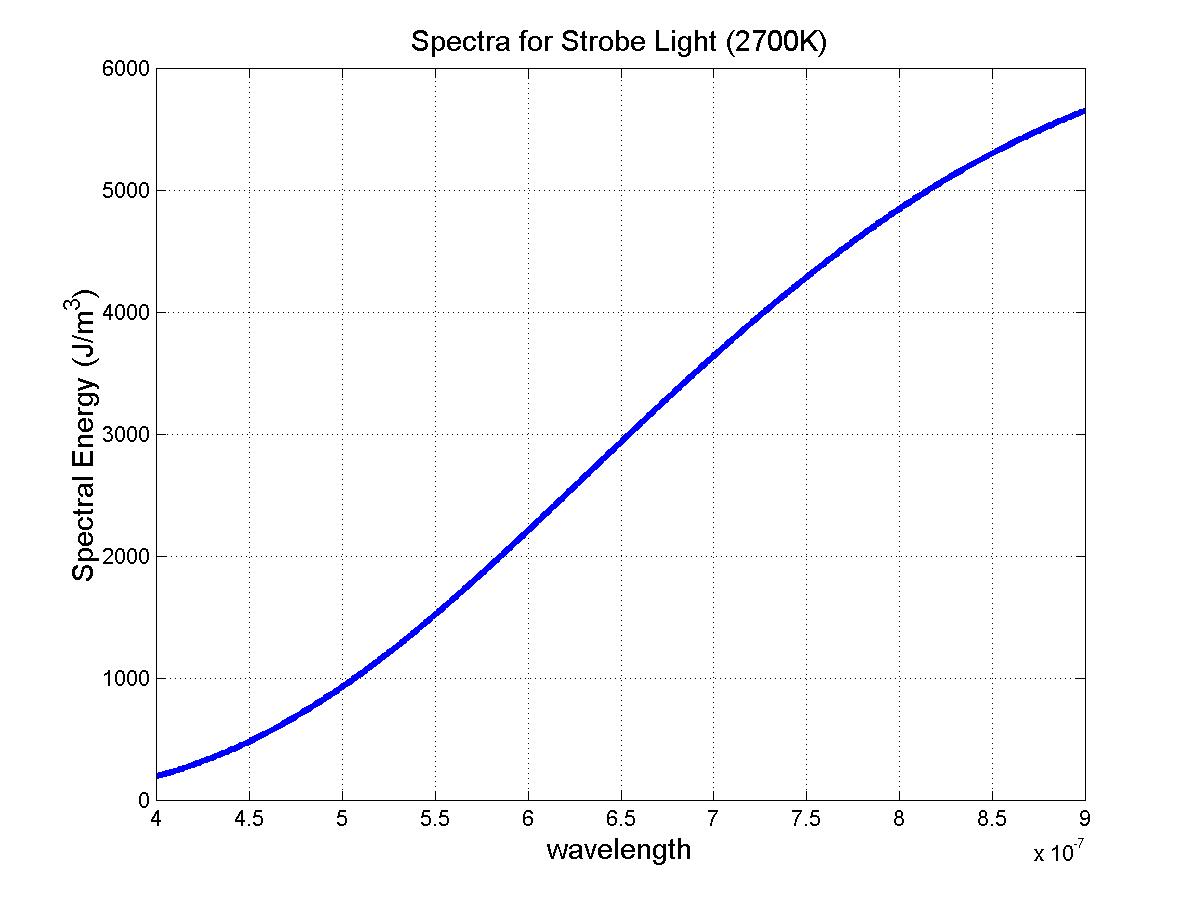
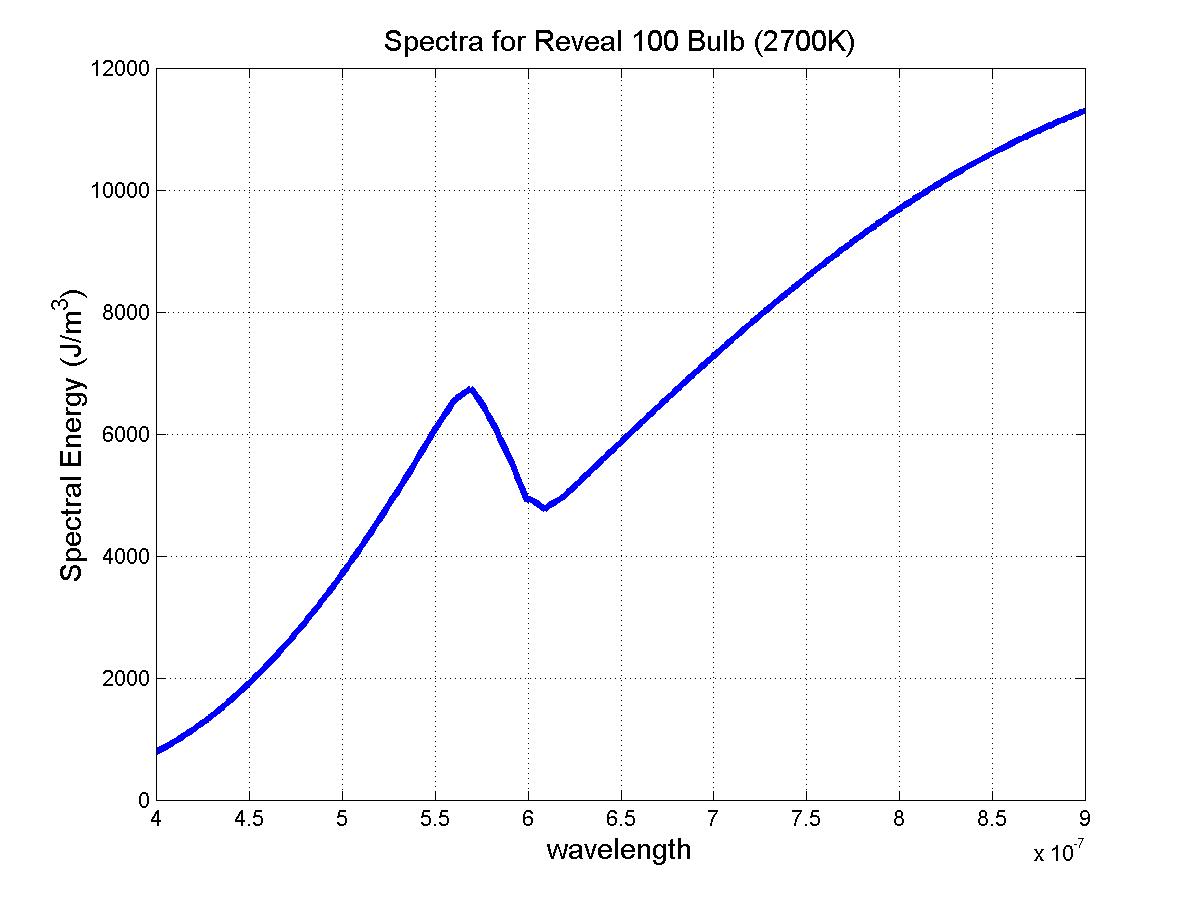
Note that the curves that follow are theoretical models of what the bulb should emit, rather than direct measurement. Ideally, direct measurement of the spectrum would be made, but measurement tools that could measure up to 900nm in wavelength were unavailable for our use. Therefore, we have modeled the sources as blackbody radiators. Also note that the following plots only go from 400 to 900nm. This is because the film loses sensitivity rapidly for wavelengths above 900nm. Further, most of the sources do not have a large spectral component below 400nm, and we are assuming the major effects occur within this range. Lastly, the numbers involved are to be compared only relatively to one another. The geometry of the light emitted from the source is not considered, and so the camera captures only a small fraction of the energy. However, since the geometry and other variables have been kept constant for each source, the results can be compared accurately.
The standard incandescent bulb, contained in the strobe light that we used, consists of a tungsten filament heated to approximately 2700 degrees Kelvin. The model of the spectra of the source was based on the formula for blackbody radiation, given above. The bulb operated at 1260 lumens, with a duty cycle approximated at 50%, reducing the light output by half. The exposures were made over many cycles to mitigate the effect of the strobe. The curve was plotted in Matlab, with the code included in Appendix I, and resulted in the following curve:
The Reveal lightbulb also uses a tungsten filament, giving a curve similar to the strobe light. However, the glass of the bulb diminishes 'yellow' light in the range of 570nm. This was modeled by multiplying the blackbody radiation by the transfer function for a notch filter with the notch at the yellow wavelengths. It operates at 100 Watts, with a light output of 1260 lumens, and is scaled accordingly, as shown below:
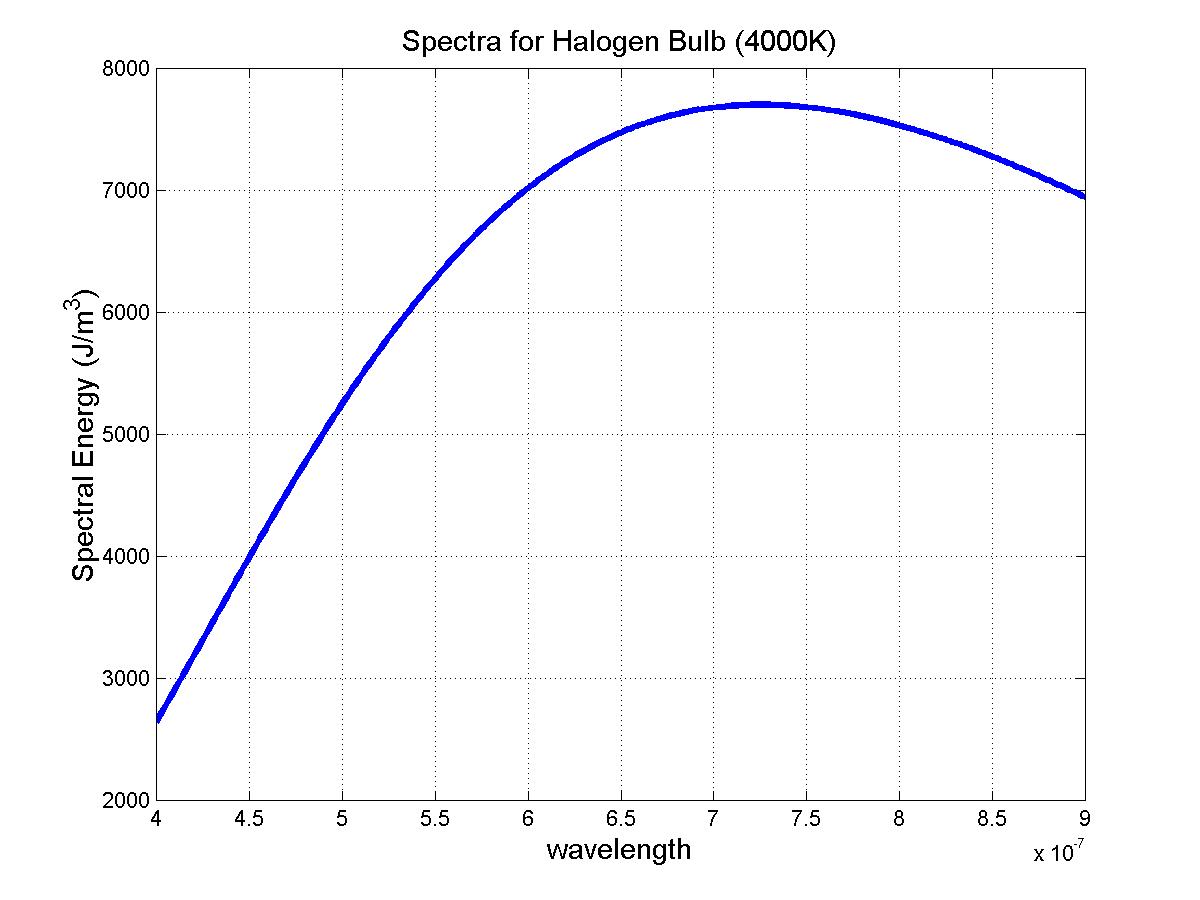
As noted here: "A short name for the tungsten-Halogen lamp. Halogen lamps are high-pressure incandescent lamps containing Halogen gases such as iodine or bromine, which allows the filaments to be operated at higher temperatures and higher efficacies. A high-temperature chemical reaction involving tungsten and the Halogen gas recycles evaporated particles of tungsten back onto the filament surface." The Halogen bulb is therefore modeled as a blackbody radiator, but at a temperature of 4000 Kelvin. The bulb is operated at 60 Watts, with a light output of 870 lumens, less than the reveal bulb, and is scaled accordingly. The result is shown below:
Daylight, after it has passed through the atmosphere, is modeled as coming from a blackbody radiator at a temperature of 6000 Kelvin. All pictures were taken on clear days, near noon when the light intensity was greatest. The pictures taken under daylight conditions were of different subjects than the other sources, and the conditions were not as controlled, and therefore a direct comparison is not made.
Home Introduction Applications Methodology Modeling Results Conclusion References Appendix I Appendix II