Results
Macbeth Color Checker Test
The Macbeth Color Checker is used to look at how the demosaicking algorithms perform at color boundaries.
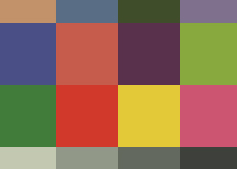
Figure 1. Original Macbeth Color Checker
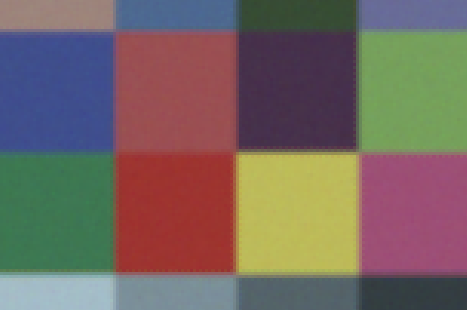
Figure 2. Demosaicked Macbeth Color Checker using Bilinear Interpolation
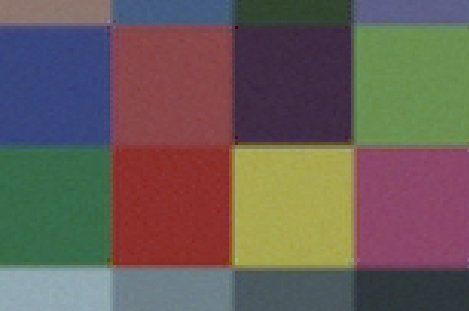
Figure 3. Demosaicked Macbeth Color Checker using PCSD
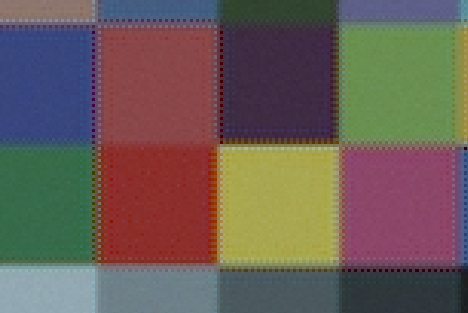
Figure 4. Demosaicked Macbeth Color Checker using Alternating Projections
Observe that deamosaicking using the Bilinear Interpolation (Figure 2) and PCSD (Figure 3) do not create severe artifacts at color boundaries. However, color dots are seen along the color boundaries when Alternating Projections is used (Figure 4). The color dots are caused by the demosaicking method looking at the 'wrong' pixels when perform deamosaicking. How the color dots are created can be nicely shown using Figures 5 & 6 below.
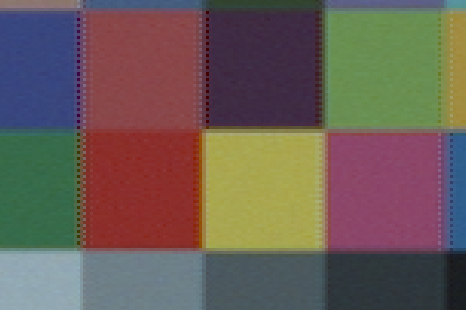
Figure 5. Demosaicked Macbeth Color Checker using PCSD with Horizontal Estimates only
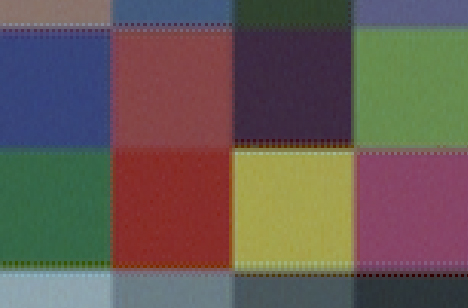
Figure 6. Demosaicked Macbeth Color Checker using PCSD with Vertical Estimates only
By adjusting the threshold in performing soft decision in PCSD, we can force PCSD to use either purely the vertical or horizontal estimates. By setting the threshold  to an extremely large positive value, only vertical estimates will be used (Figure 6). On the contrary, by setting to an extremely large negative value, only horizontal estimates will be used (Figure 5). While neither of these test cases will produce satisfying demosaicked images, this helps us to understand the 'color dot' artifact produced by the Alternating Projections algorithm.
It can be seen from Figure 5 that if we only use the horizontal estimates, 'color dots' will appear at the vertical boundaries. This is because at these boundaries, the true RGB colors in the horizontal direction can be drastically different, and estimating the missing R/G/B colors just by looking at the color values in the horizontal direction is likely to give errors. Similarly, from Figure 6, using vertical estimates only will give errors at horizontal boundaries since the values of pixles at the vertical direction might be completely different from the value we want to estimate.
Comparing Figure 5 and Figure 6 with Figure 4, we can see that the artifacts are very similar, thus concluding that the 'color dot' artifact in Figure 4 is caused by using the incorrect neigbors to estimate missing color values.