EyeLab: An Automated LED display analyzer
Results
Using Test Data
The MSE in identification and run time were found and are displayed in Tables 1 and 2 below. Note that run-times for the Neural Network algorithm include training time.
| Smart-strokes | Cross-correlation | Neural Networks | |
560 420 420 | 2.86 | 1.30 | 0.42 |
|
280210 | 2.80 | 1.82 | 0.51 |
|
140105 | 3.30 | 2.75 | 0.81 |
Table 1 - Mean-Square Error (MSE) for all algorithms when run on generated test data.
| Smart-strokes | Cross-correlation | Neural Networks | |
|
560420 | 7.2 | 23 | 4.2 |
|
280210 | 5.6 | 22 | 6.1 |
|
140105 | 5.2 | 20 | 5.6 |
Table 2 - Run time (seconds) for all algorithms when run on generated test data.
Two so-called “confusion diagrams” were created with the maximum resolution data to illustrate which digits were misidentified the most, and to learn about the various failure modes of the algorithms. These are shown in Figures 12 and 13. Each element along the  -axis represents a particular trial of a digit at a particular orientation. The white region of the column corresponding to each ’s trial corresponds to what the algorithm thought the digit should be. Recall that we had one hundred ‘‘runs’’ of each digit, thus corresponding to one hundred ‘‘vertical white strips’’ per digit.
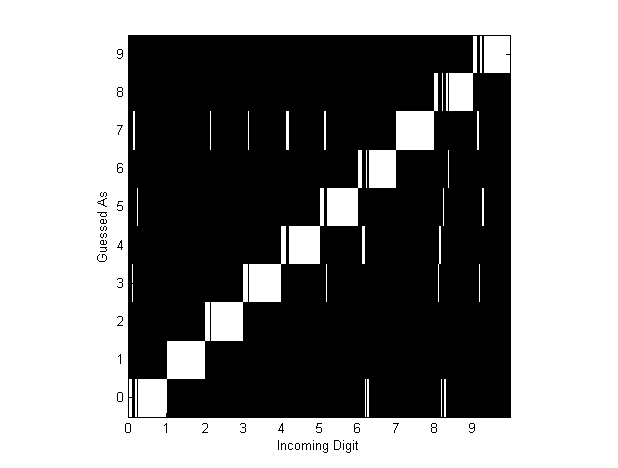
Figure 12 - Confusion Diagram for "Smart-strokes"
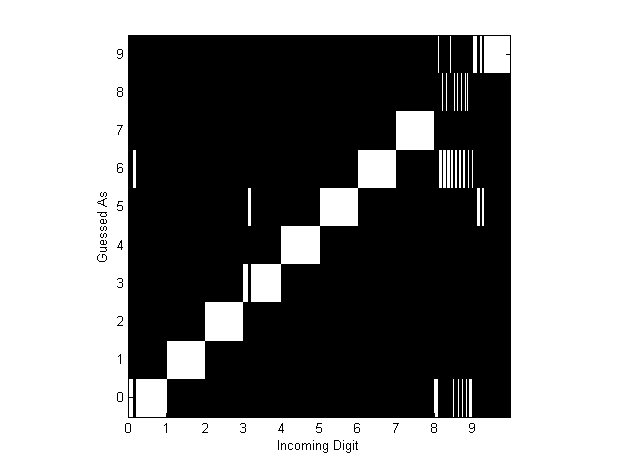
Figure 13 - Confusion Diagram for Cross-Correlation
Using “Real” Data
For the “real data,” only the “Smart-strokes” and cross correlation algorithm were run, and only the run time could be computed. Note that the run-time for cross-correlation does not include the time it took for the user to identify the training digits. The results are in Table 3 below.
| Smart-strokes | Cross-correlation | |
|
640480 | 23 | 210 |
|
320240 | 24 | 80 |
|
160120 | 23 | 72 |
Table 3 - Run time (seconds) for Smart-strokes and Cross-correlation when run on real data.
While we can’t quantitatively determine the MSE for the “real data,” it is still instructive to qualitatively look at the result of the identification algorithms for this data. Figures 14 and 15 below show the output of the system when measuring the real data.
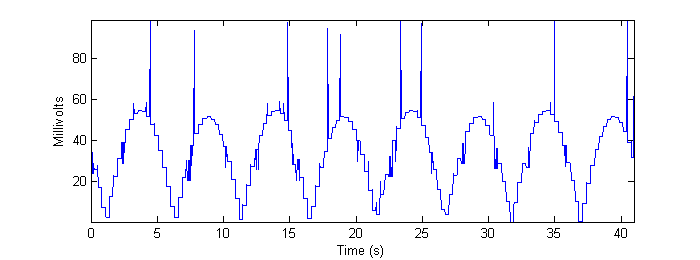
Figure 14 - Output of "Smart-strokes" algorithm applied to max-resolution real data.
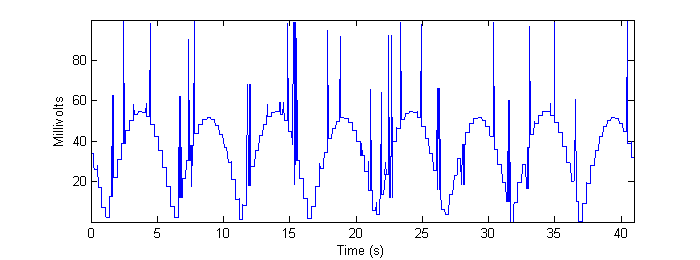
Figure 15 - Output of cross-correlation algorithm applied to max-resolution real data.
Without a “gold standard,” it is difficult to gauge what happens to the accuracy of the algorithms acting upon the real data as the video is downsampled. Figures 16 and 17 show the outputs of the two algorithms on the highly downsampled 160 120 video:
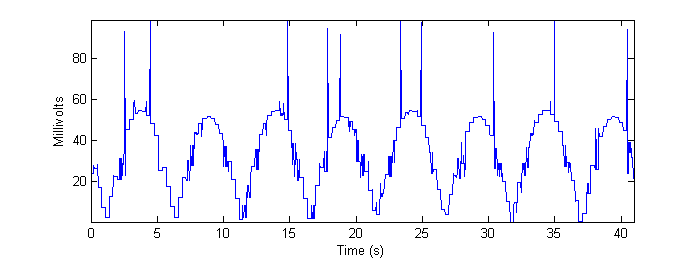
Figure 16 - Output of "Smart-strokes" algorithm applied to low-resolution real data.
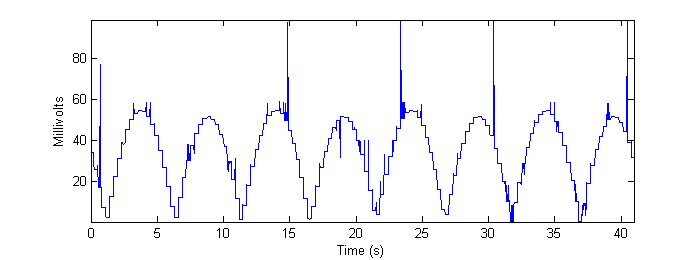
Figure 17 - Output of cross-correlation algorithm applied to low-resolution real data.
The reader is encouraged to compare the preceding four figures to Figure 7b in Methods. Note, especially, the quantization artifact observed in the real data, as well as random “spikes” of misidentification that appear. The frame-grabs pertaining to these particular errors are shown and discussed in Conclusions.