|
Index | Introduction | Methods | Results | Conclusions | References and Acknowledgements | Appendix |
|
Methods
Overview
To determine individual variations in color vision abilities, I needed a software system that could generate randomized Ishihara-like plates along pre-defined confusion lines, and be able to control how far apart the hue ranges for the foreground and background are. In addition, it should also allow for the adjustment of hue variation and brightness variation, and finally, the software needed to be easy to deploy in a test environment.
The Color Space
The sRGB color space was used for this software. The sRGB color space is a RGB color standard that is becoming increasingly common in the computer and electronics industry. It is the default color space for Java, Microsoft, and comes pre-calibrated on many displays and cameras.
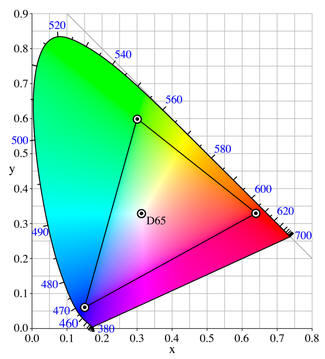
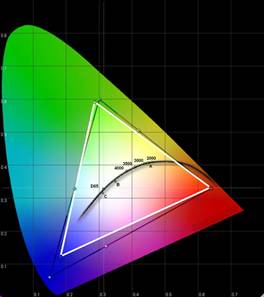
The gamut of the sRGB color space, in CIE xy chromaticity coordinates, are:
The gamut, overlaid on the CIE xy chromaticity diagram, is:
There is a easy, defined linear transformation from the XYZ color space to the sRGB color space:
Source: [5] http://en.wikipedia.org/wiki/SRGB_color_space
The Software
The color vision testing software was programmed from the ground up with the Java programming language, an easy-to-code, extensible, object-oriented language with an excellent, free, open-source development environment.
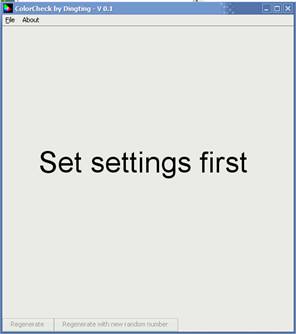
The final version of the software looks like this when opened:
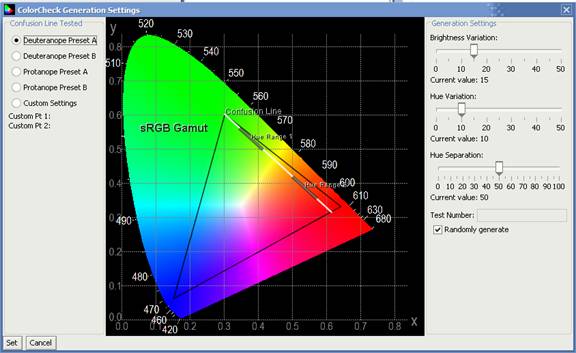
Going to File->Settings opens the settings dialog box:
On the left, you can select a confusion line to test on, or define your own confusion line with the “custom settings” tool. The preset confusion lines are:
In the middle, you can see both the CIE xy chromaticity diagram, the sRGB color space gamut, the confusion line, and the foreground/background hue ranges tested. The confusion line is white, and the hue ranges are a transparent gray. Hue Range 1 is the color range for generating foreground colors, and Hue Range 2 is the range for generating background colors. Colors are uniformly generated from the entire range.
In the first slider on the right, you can adjust the brightness of the colors generated. The baseline brightness is Y=0.5, so when the brightness variation is set to the max of 0.5, the entire range of brightness generated. The second slider adjusts the hue variation; you can see the hue range changing in real time as you adjust the setting. The third slider adjusts the hue separation; again, you can see the hue ranges change in real time as the setting is adjusted.
Finally, you can set the test number (or letter) to generate, or you can have the program randomly generate numbers for you.
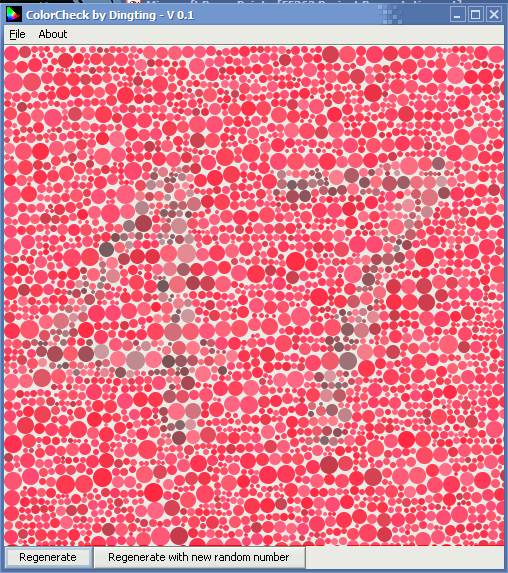
After clicking set, you will see something like the following: (Note: if at anytime the image seems corrupted, press “regenerate”)
This is a randomized chart generated with the following settings: Confusion line = ProPresetB, number = 47, BriVar=15, HueVar=10, and HueSep=20.
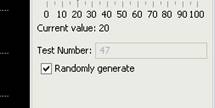
If you chose to generate plates with random numbers, you can see the current number by going to the settings dialog box:
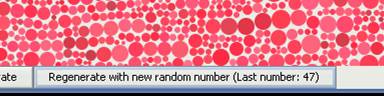
Alternatively, if you click “Regenerate with a new random number”, a new plate will be generated with another number and the same settings. You will also be able to see the last number generated.
Test Equipment
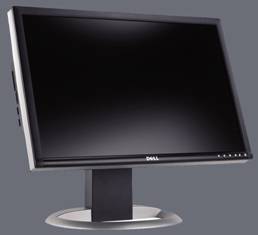
The test was run with a Dell 2405FPW 24” PVA LCD, a large high resolution, high color fidelity, and high consistency display.
The monitor has an extremely wide gamut, as measured with a Minota CA-210, which fits closely with the sRGB color space.
Source: [6] http://www.extremetech.com/article2/0,1558,1764458,00.asp
In addition, the delta E tracking shows that the 2405FPW's color fidelity is extremely accurate across a wide range of brightnesses:
Source: [7] http://www.behardware.com/articles/567-2/comparatif-lcd-23-24-pouces.html
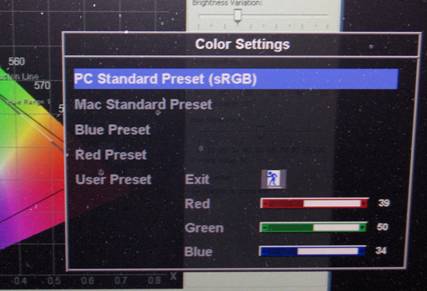
Finally, the display came with a pre-calibrated sRGB setting, which was used throughout the tests:
The Test
The test was conducted by giving each subject a sequence of 6 randomly generated plates at a Brightness Variation of 15 and a Hue Variation of 10 for each of the 4 preset confusion lines, at a variety of Hue Separations.
The subject passes the exam at a certain Hue Separation if 5 out of 6 plates were identified correctly. The Hue Separation is decreased until the subject can no longer identify 5 out of 6 plates. The lowest Hue Separation (highest difficulty) for which the subject IS able to identify 5 out of 6 places is recorded as that subject’s score.
|