Results
Spatial Frequency
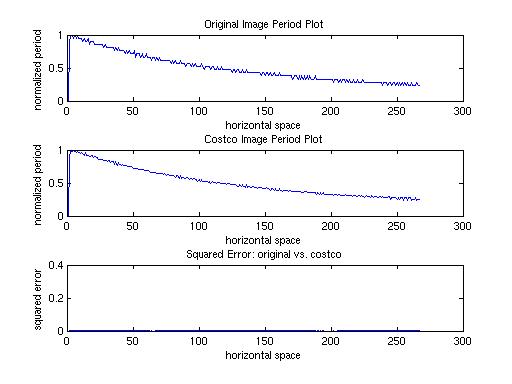
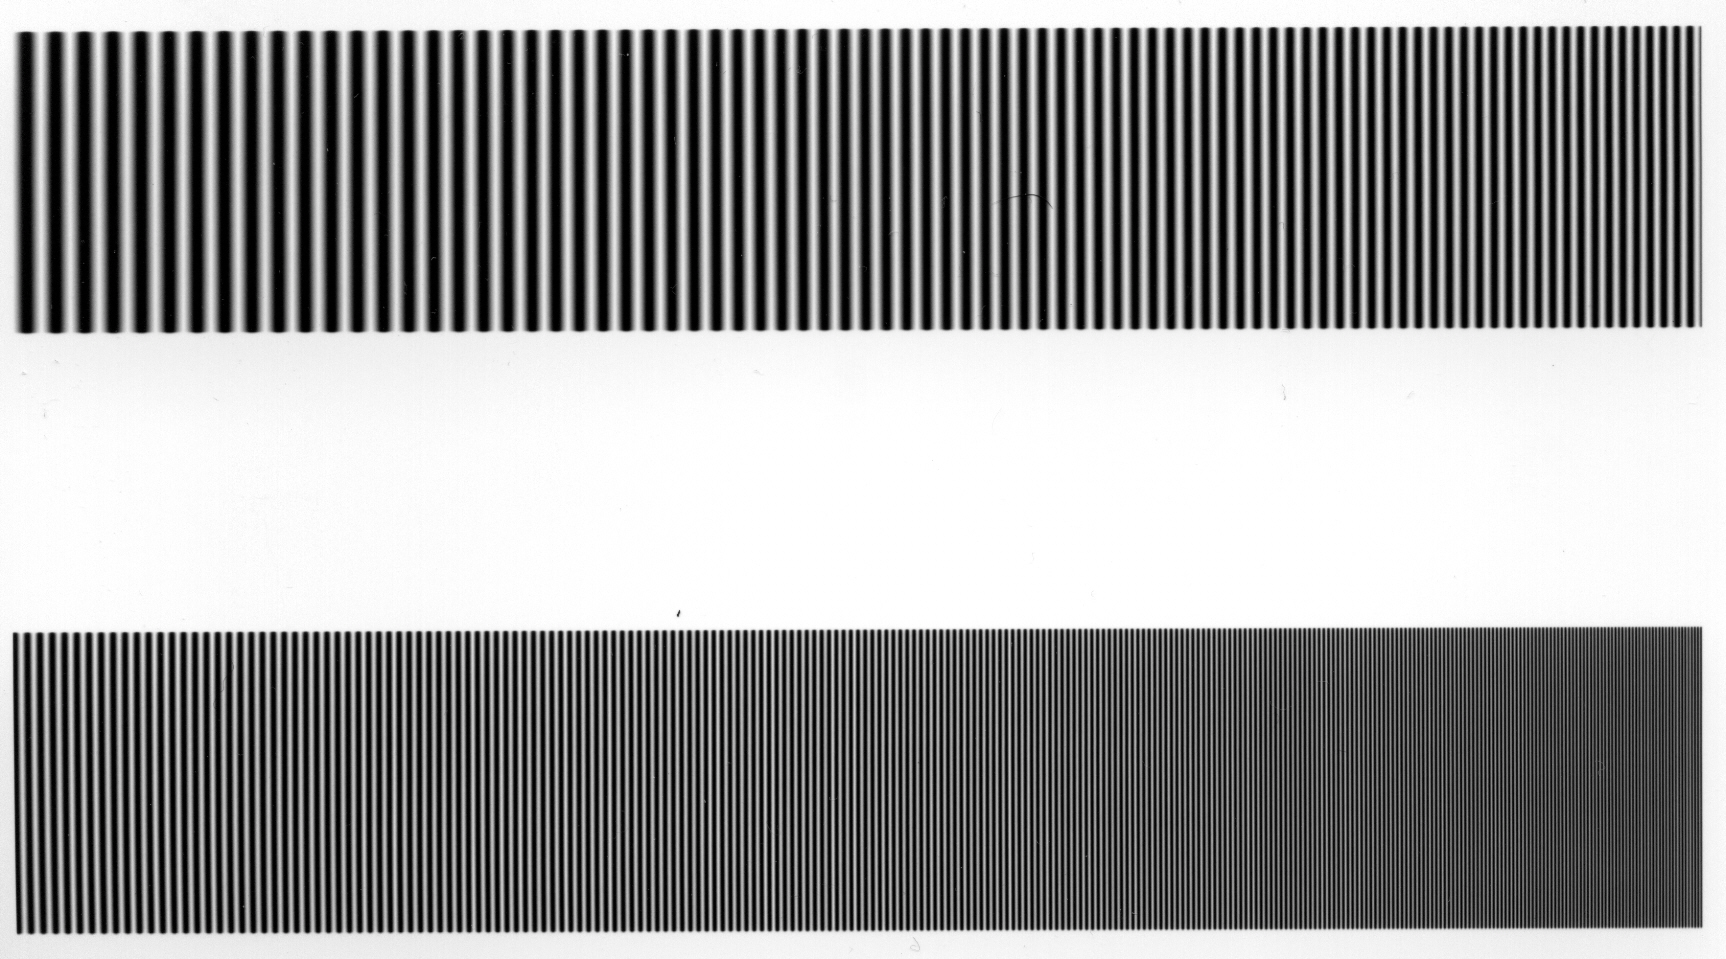
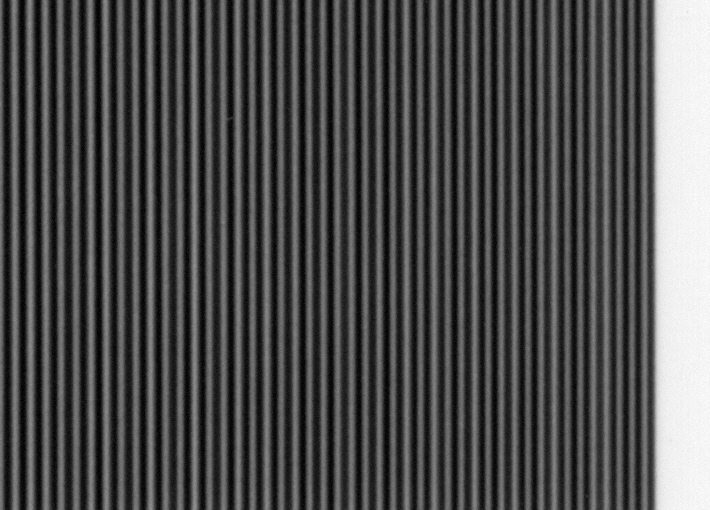
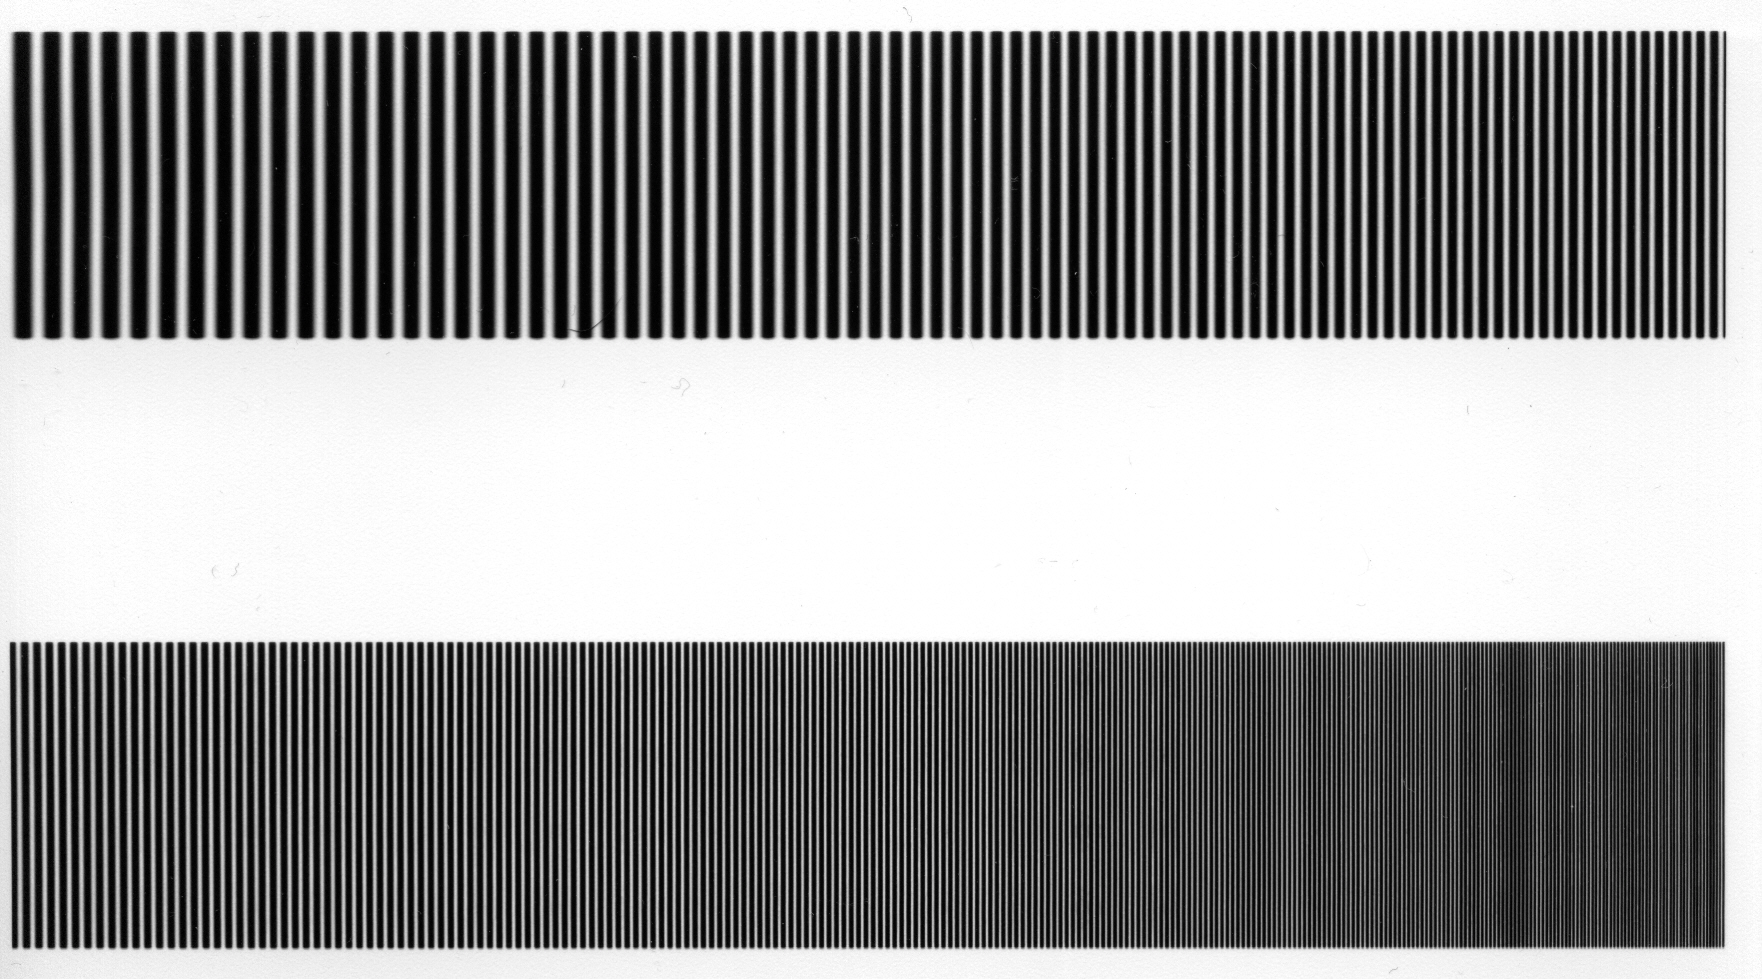
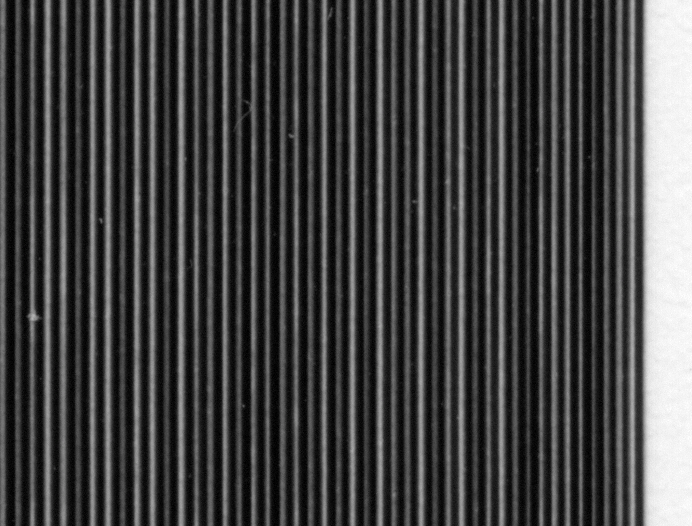
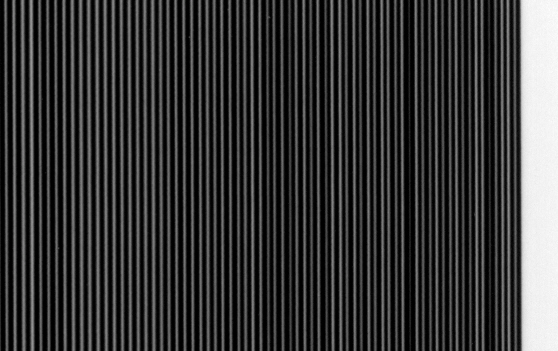
Three graphs are displayed for each printing service. The first plot is the period curve of the test image. The second plot is the period curve for the scanned print. The third plot shows the squared error between the test image and the print.
|
Costco |
|
As can be seen from the plots, the Costco print was very good. There was no aliasing even at the highest frequency (smallest period) end of the image. The squared error hardly even registers on the plot. |
|
Wal-Mart |
|
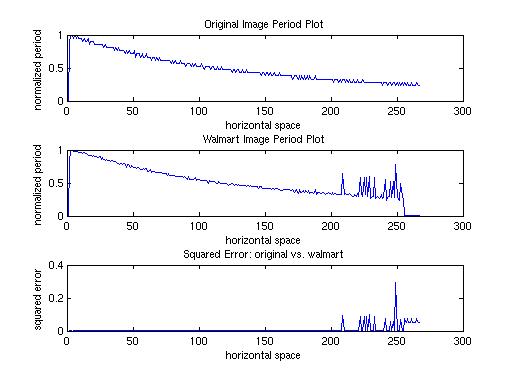
The Wal-Mart print was not as good as Costco. Towards the high frequency end of the sinusoidal pattern it began to alias slightly. This can be seen in the print, and the plots to the left. |
|
Fotki |
|
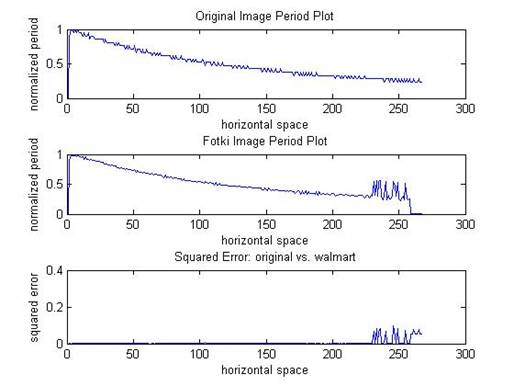
The Fotki print also aliased at the high frequency end of the sinusoidal pattern, but not as early on as Wal-Mart. |
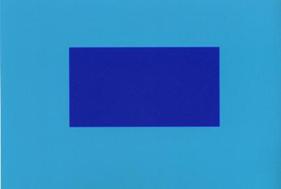
Color Resolution
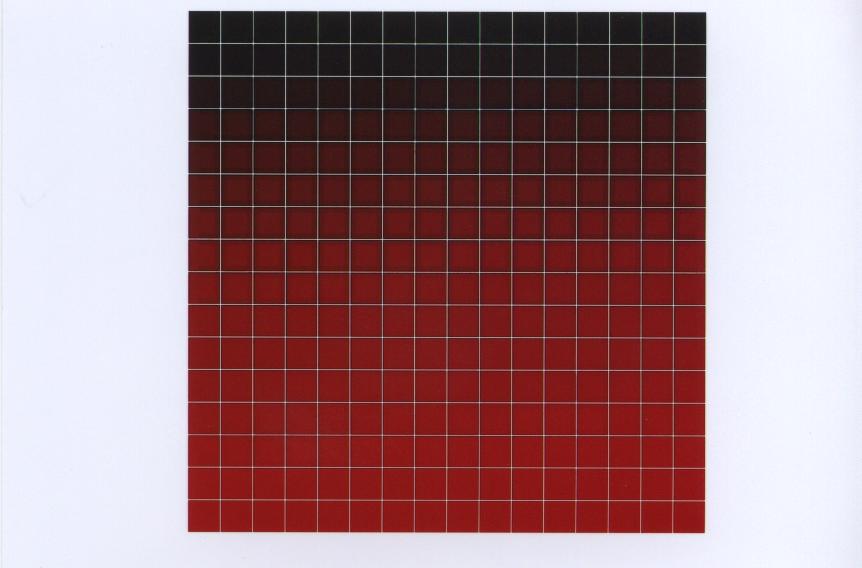
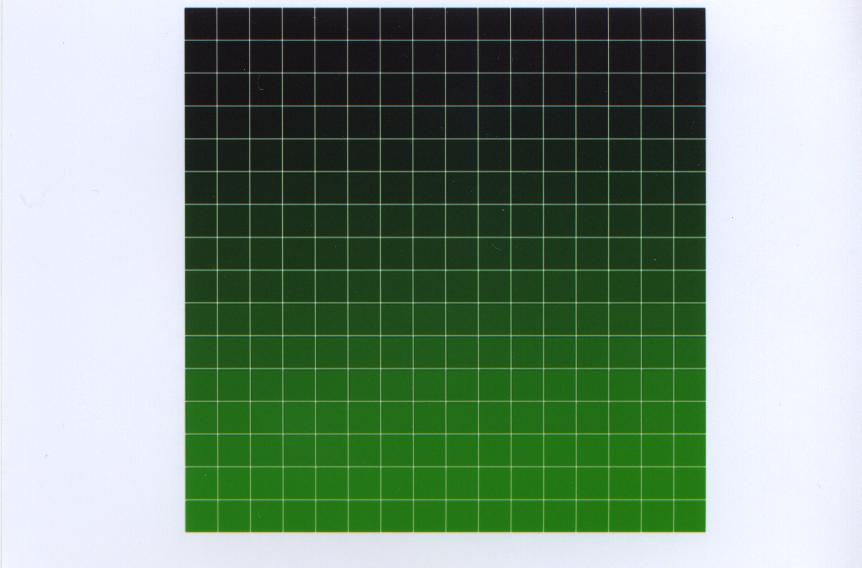
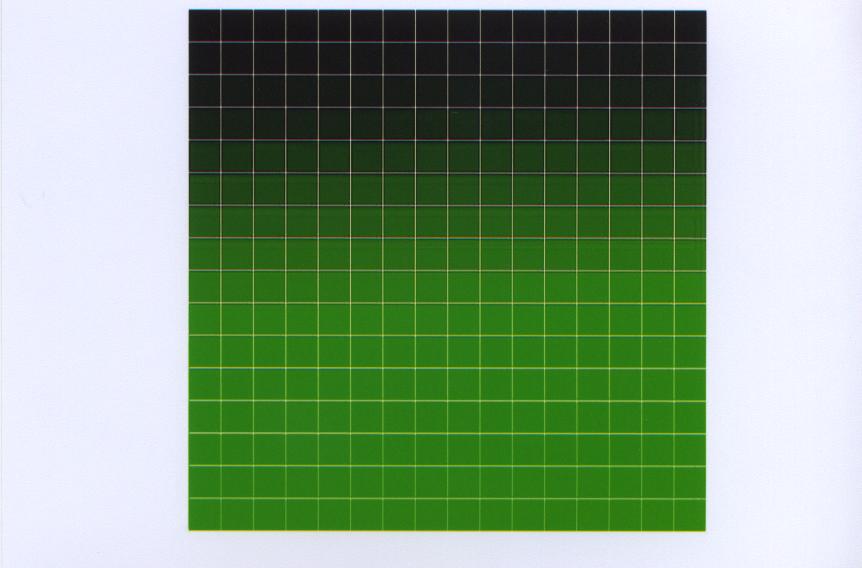
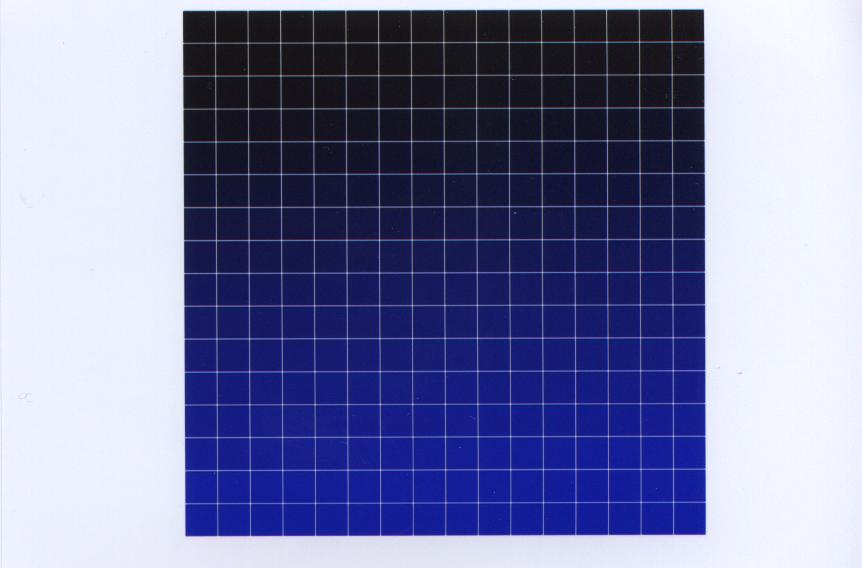
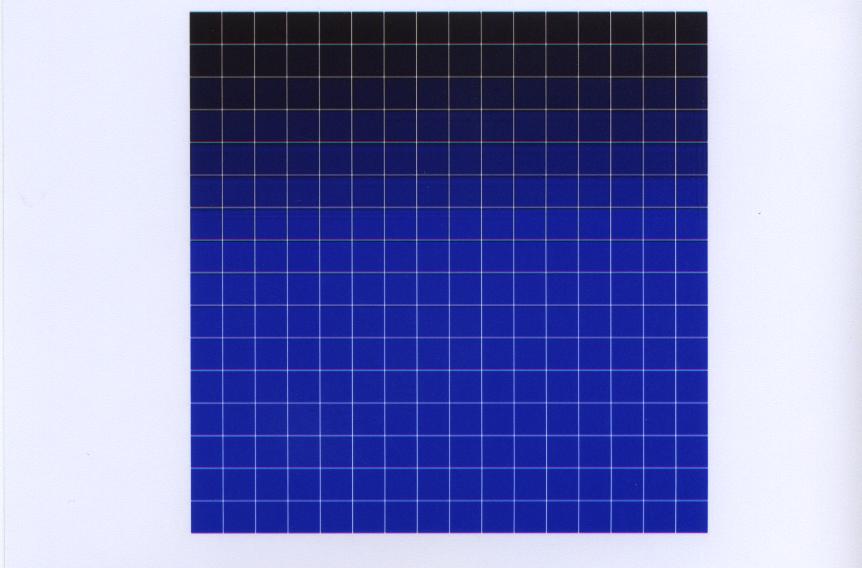
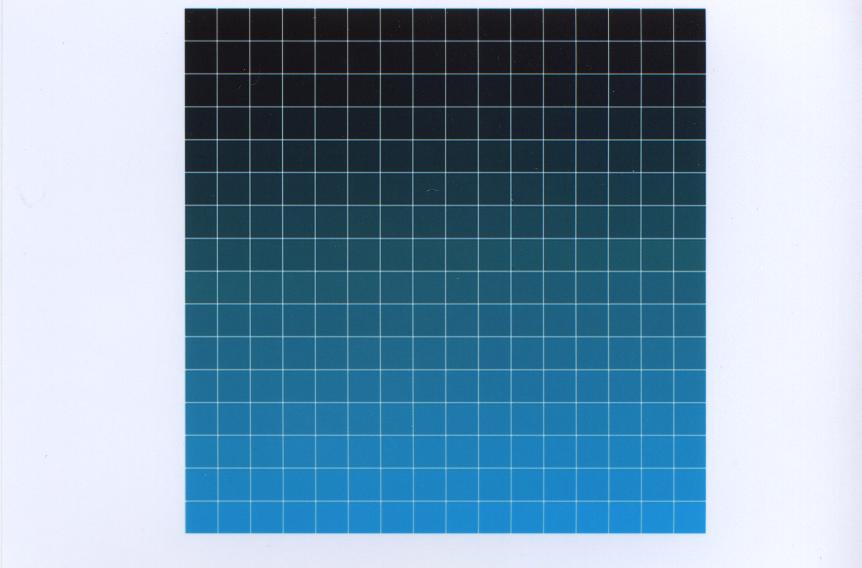
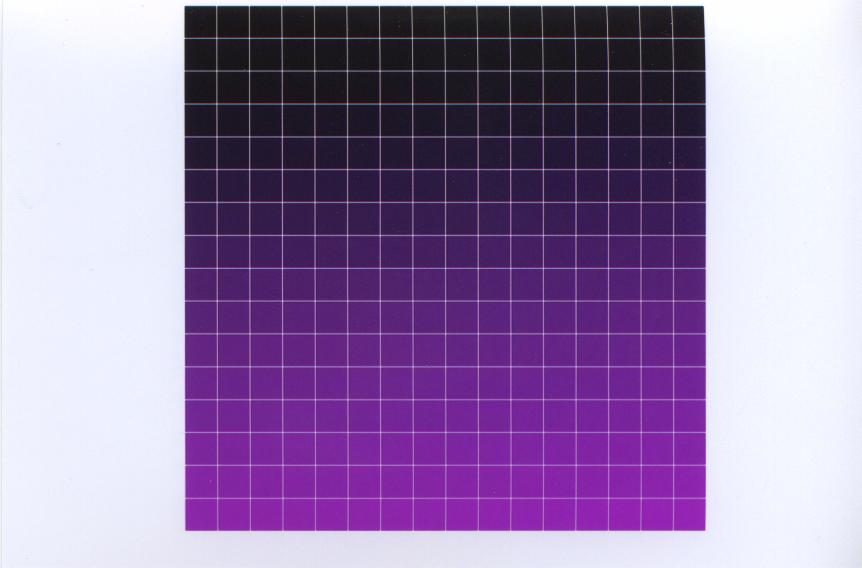
When we designed this test we expected that some of the services would not be able to reproduce all 256 shades of each color. The data that we received from the prints however did not show this to be the case. All of the companies were able to reproduce continuously darkening shades of each color. However they did so at different rates, saturating at different points along the 256 block gradient. The data follow different trends for the primary colors (RGB) as it does for the secondary colors (CMY), so we will look at those two groups separately. First we will look at red, green, and blue.
First we will look at a plot of the Costco print data for the blue test image.
Although it takes a little while to ramp out of the darkest shades, it can be seen from the plot that Costco produced a fairly linear progression from black to blue. This data is fairly representative of Costco’s primary color data. Each block in the progression is a fairly consistent step towards the bluest blue. Wal-Mart and Fotki had different results.
|
|
|
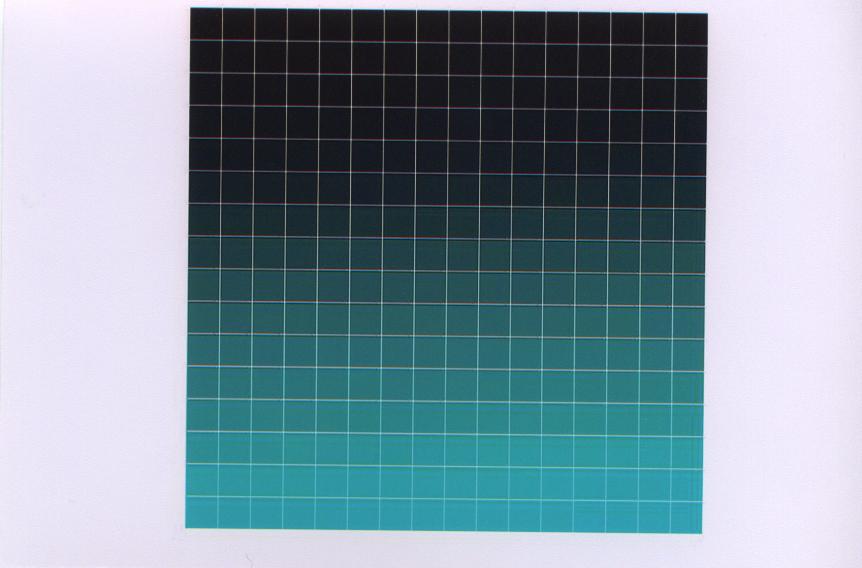
Walmart and Fotki both saturate early on. Wal-Mart saturates around block 100, and Fotki around block 150. After those points the blue is statistically the same all the way to the end. This is also fairly representative of Wal-Mart's and Fotki's primary color data.
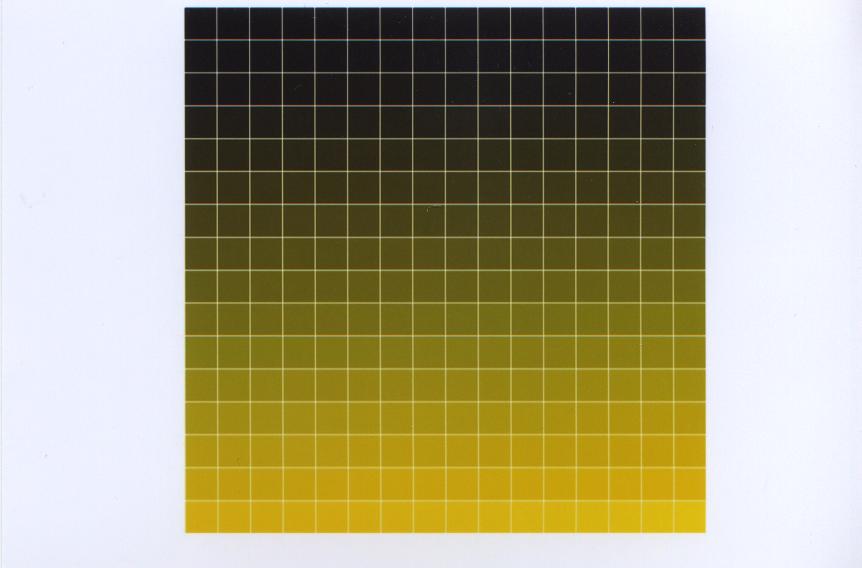
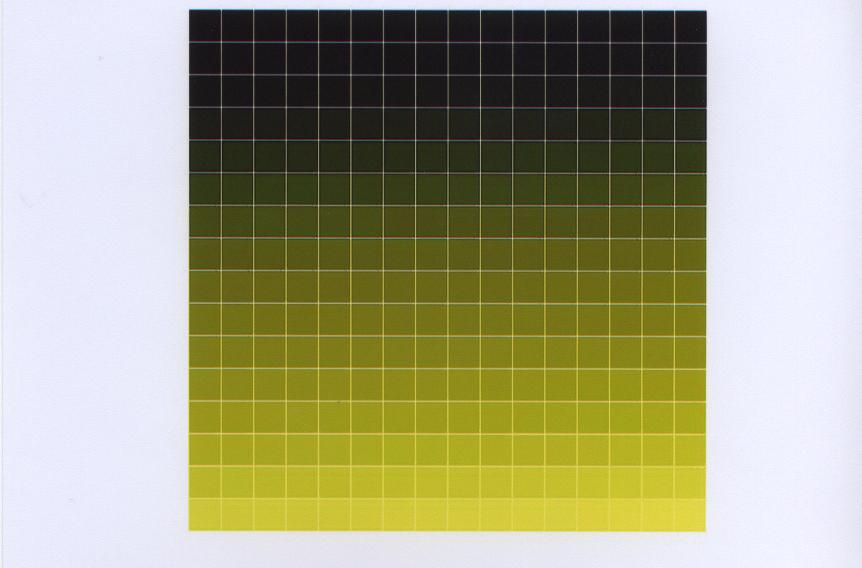
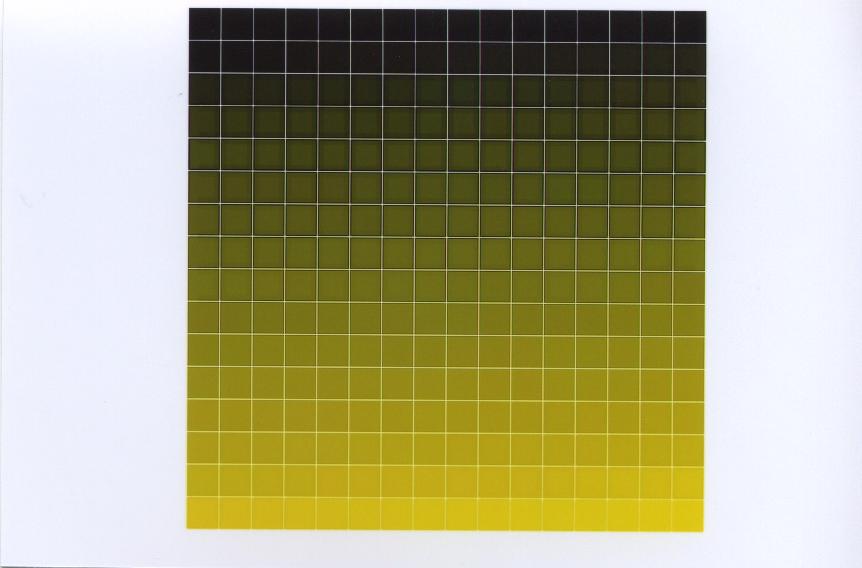
Cyan, Magenta, and Yellow had what appear to be better results than the three primaries. We will examine the yellow data here.
|
|
|
|
As can be seen from this data, none of the prints saturate early on like they did for the primary colors. All of the progressions from black to yellow are close to linear (excluding ramp up time). The cyan and magenta data have similar trends, though not quite as clean as the yellow data. |
|
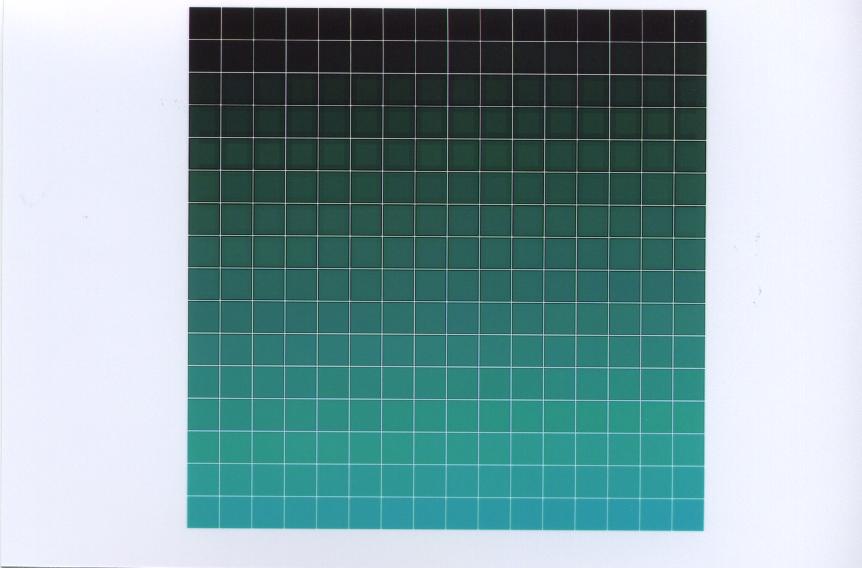
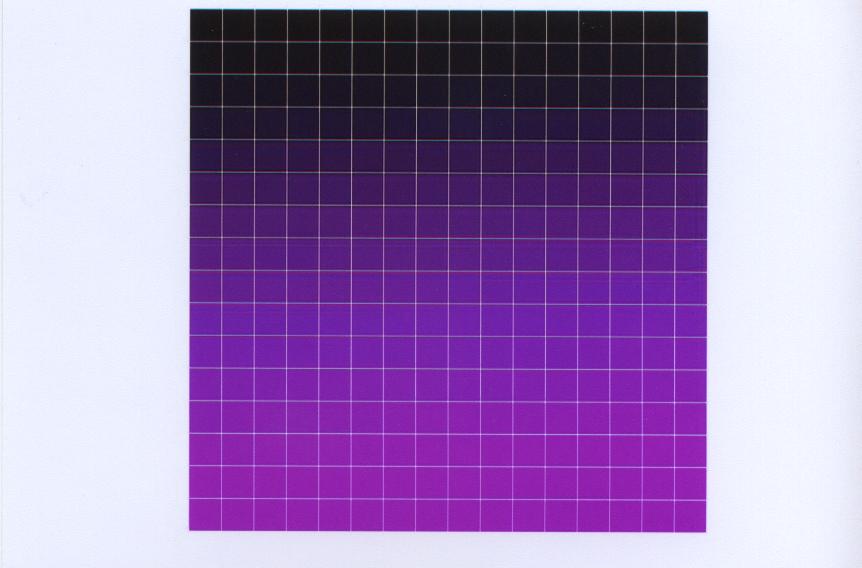
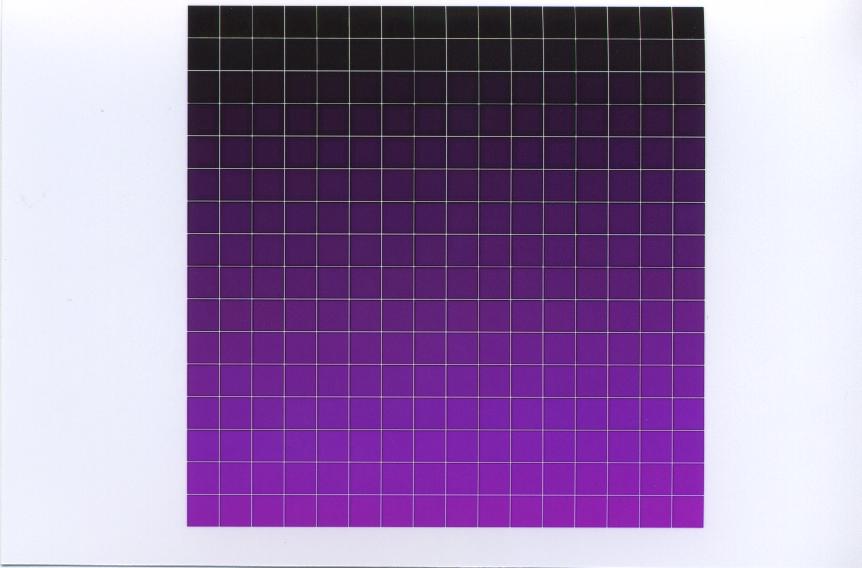
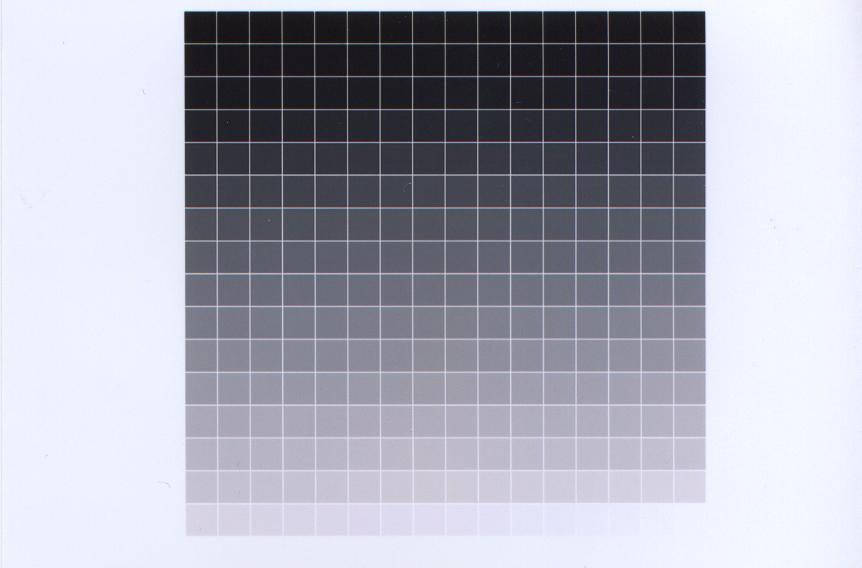
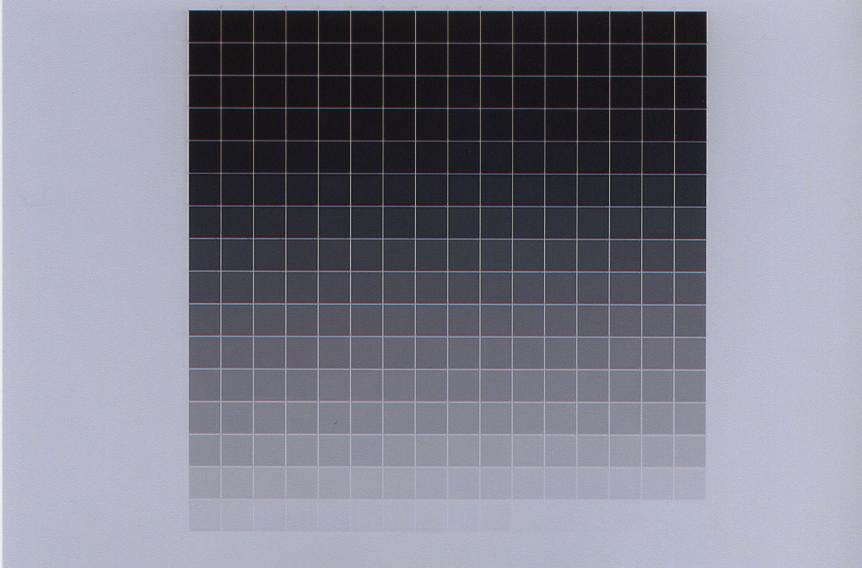
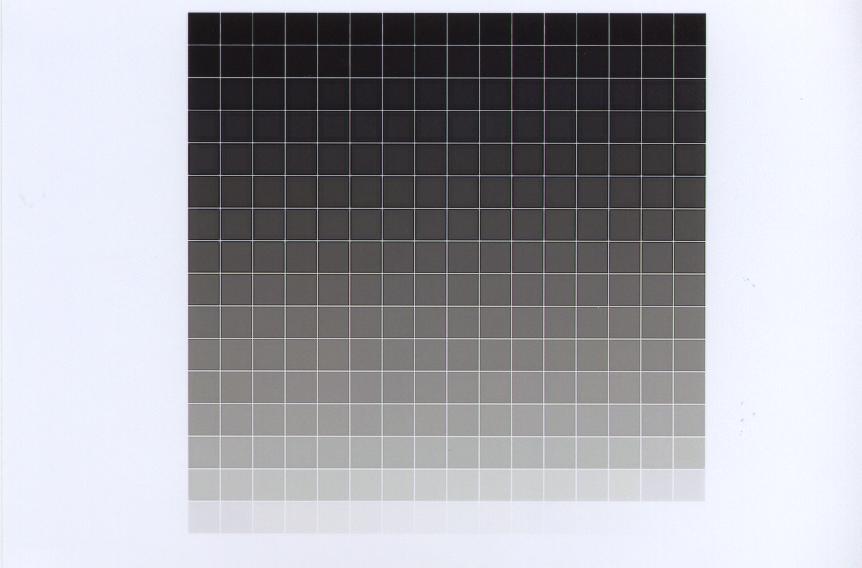
The last color that we want to look at is white. There are a few data points that we wanted to extract from this data. Not only did we want to see how smooth of a curve would be produced, but we also wanted to observe how black a printer's darkest black was, and how white it's brightest white was. Let's look at the data.
|
|
|
|
We first observe that all three prints have almost linear progressions from black to white. Wal-Mart takes a little longer to begin the ramp up than the other two, and also ends with a less intense white than the other two companies. It is very obvious in looking at the Wal-Mart print that the white is very gray. We also can see that all three prints have very similar black values, and apart from the Wal-Mart anomaly, the whites also have similar values. |
|
Color resolution data
|
Costco |
|
|
Wal-Mart |
|
|
Fotki |
|
|
|
|
|
|
||||||
|
|
|
|
||||||
|
|
|
|
||||||
|
|
|
|
||||||
|
|
|
|
||||||
|
|
|
|
||||||
|
|
|
|
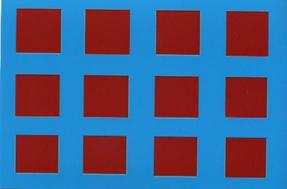
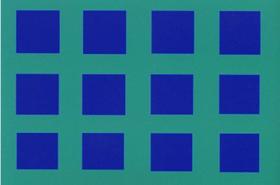
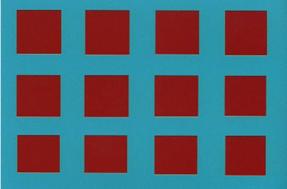
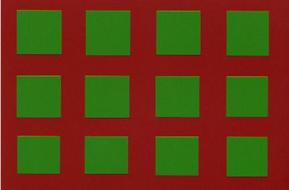
Color Context
With 36 test images per printing company there is way too much data to present in this report. We will attempt here to present selected data that give a good representation of the general trends.
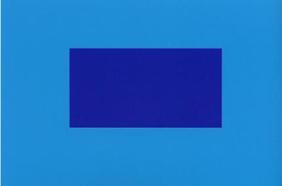
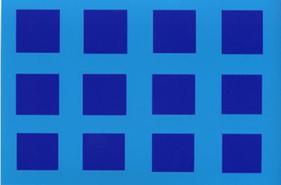
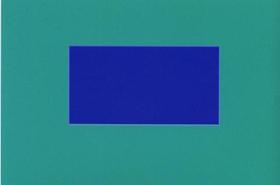
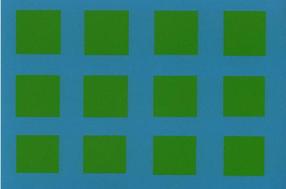
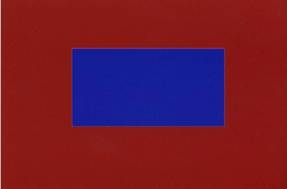
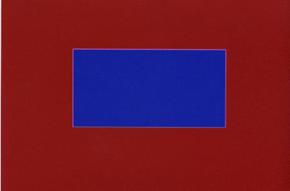
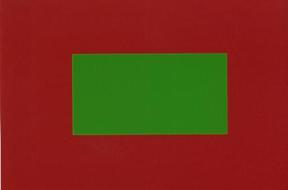
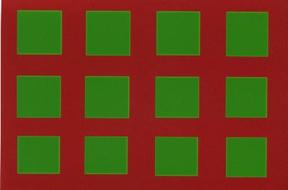
We found that the colors that were most dependent on the surrounding colors were the secondary colors, yellow, magenta, and cyan. Let us first observe the images with a cyan background and the respective data.
|
Costco Prints |
|
|
|
|
|
|
|
|
|
Wal-Mart Prints |
|
|
|
|
|
|
|
|
|
Fotki Prints |
|
|
|
|
|
|
|
|
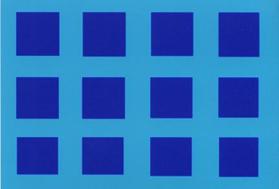

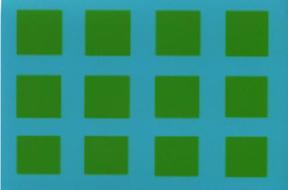
As can be seen in the above graphs and images, Fotki and Wal-Mart produced very different cyan values depending on the interior color. Costco on the other hand produced a very consistent cyan, independent of the surrounding colors. This general trend holds for the other secondary colors.
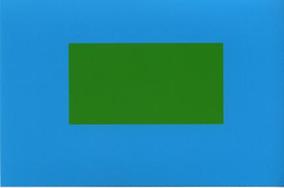
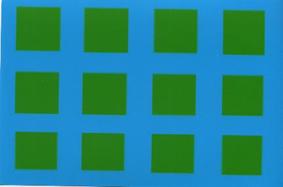
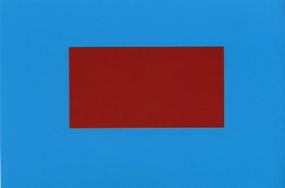
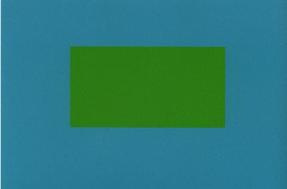
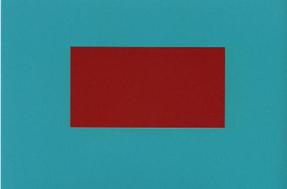
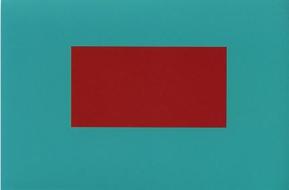
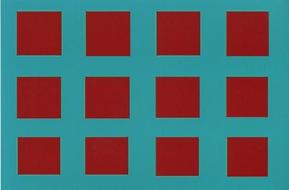
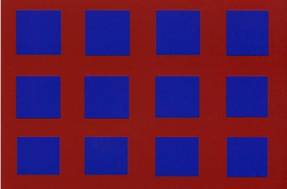
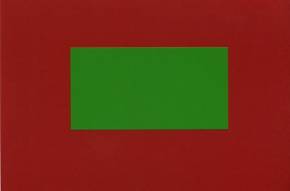
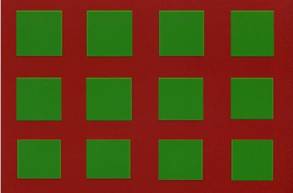
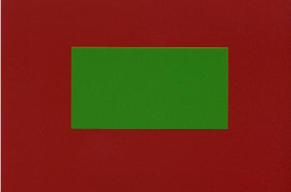
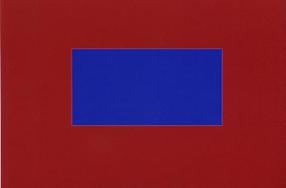
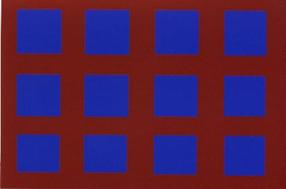
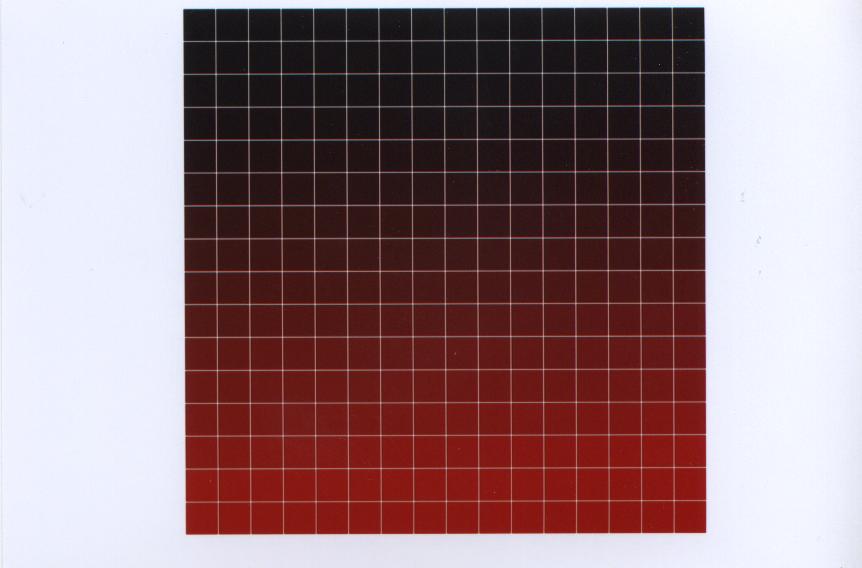
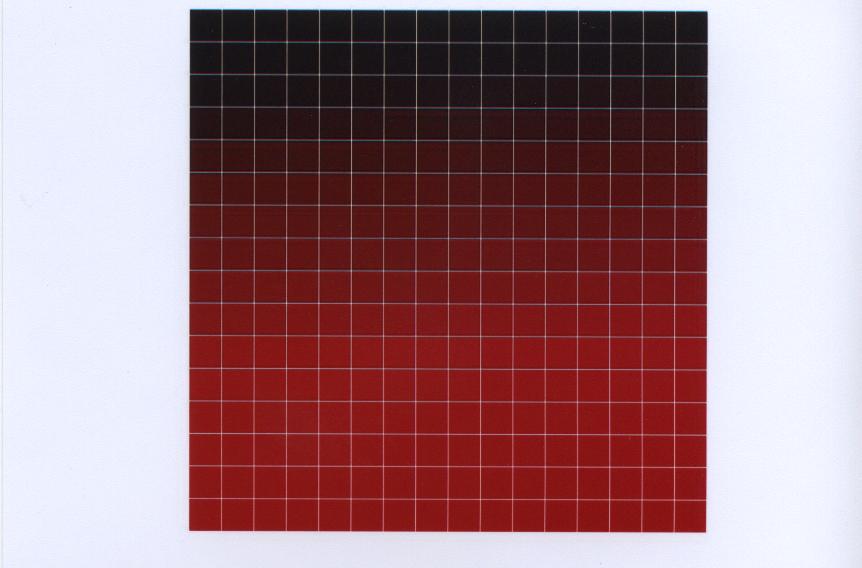
The primary colors on the other hand were much more consistent across the board. Let us look at the images with red backgrounds and the respective data.
|
Costco Prints |
|
|
|
|
|
|
|
Wal-Mart Prints |
|
|
|
|
|
|
|
Fotki Prints |
|
|
|
|
|
|
As can be seen in the above graphs there is very little variation in the red background color values with different interior colors, with a single anomaly in one Fotki print. This general trend also holds for the other primary colors. It should also be noted that the value of the reds shown here over all three companies are fairly consistent. This is not the case in our above cyan example, where the three companies all had markedly different values of cyan.
As was mentioned before, there is a large amount of data that was analyzed and processed for this test. We cannot provide all prints at their original size because of size concerns. However, downsized versions of the prints along with the data and graphs can be found below.