Methods
We designed three different tests, each with a set of test images to test different limitations of the three digital photo printing services.
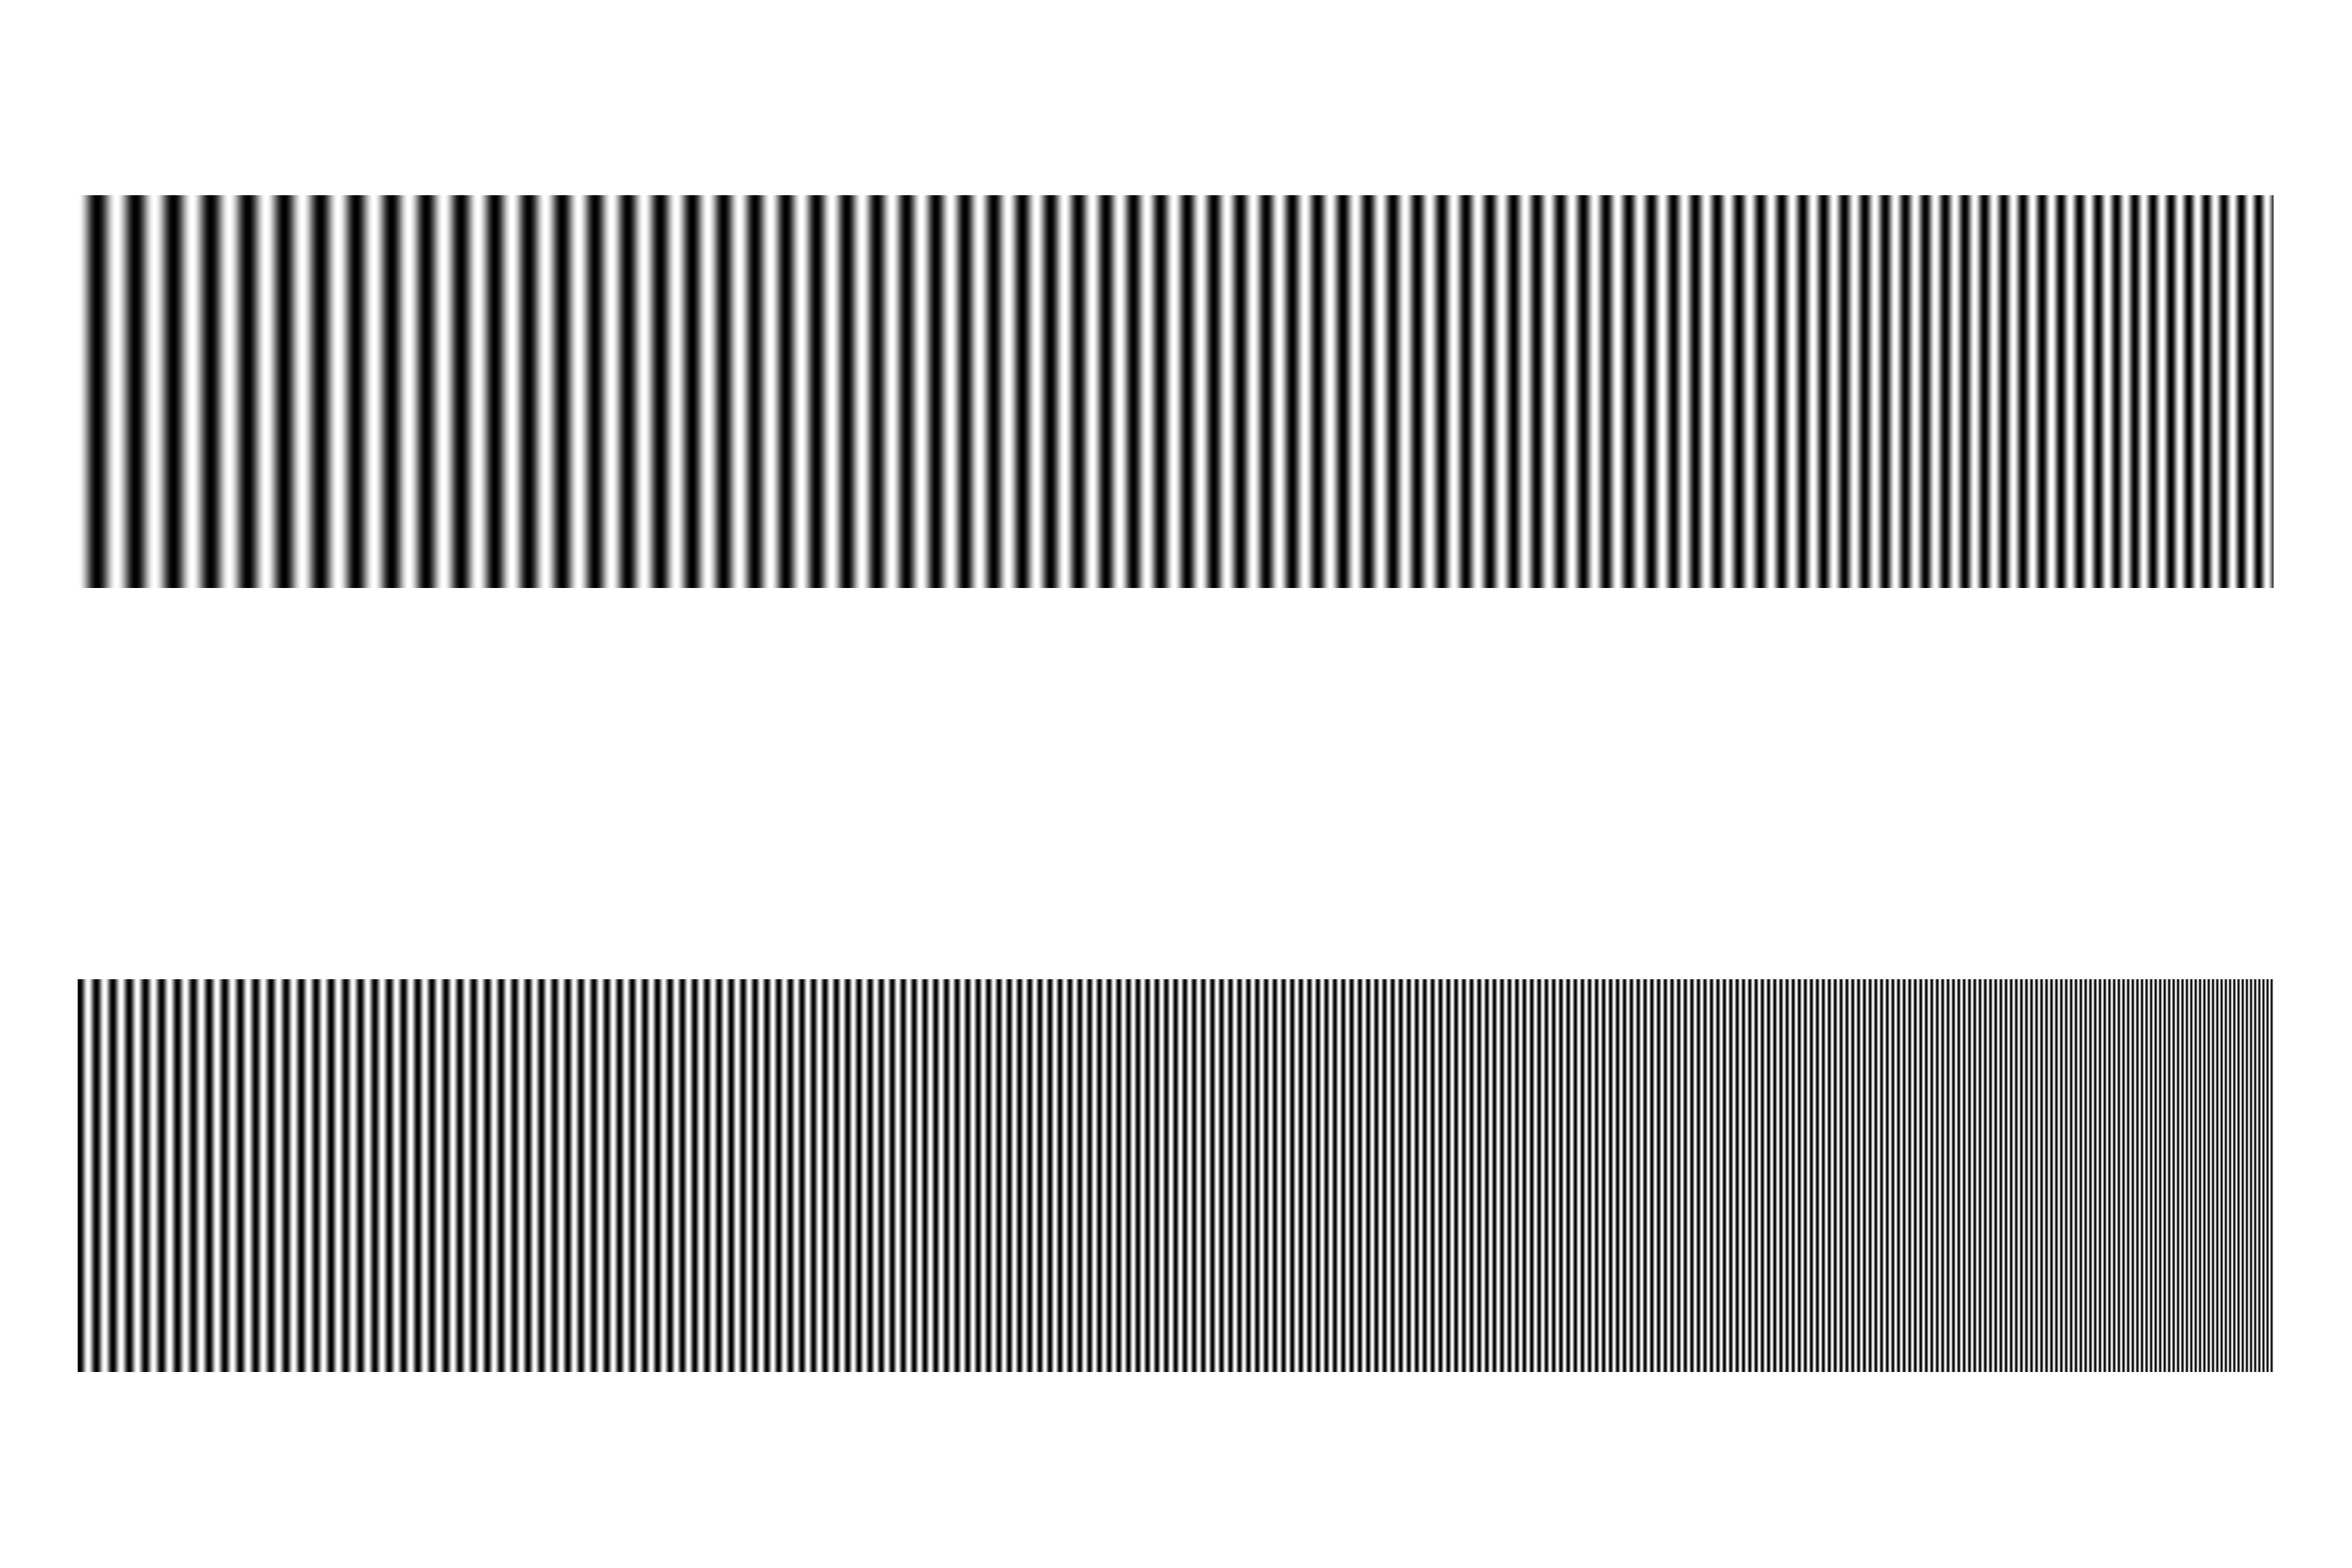
Spatial Frequency
The first test was designed to measure the limits of what spatial frequencies could be printed by the different services. In order to do this we wrote a Matlab script that produced a 2000x3000 pixel bitmap test image. The test image contains a one dimensional sinusoidal pattern that sweeps from a low frequency to a very high frequency. The high frequency end of the sinusoidal pattern was such that we believed it would be hard to reproduce on a 4x6 print. The test image along with the Matlab script that created it is linked below.
Once we received the prints back they were scanned on a flatbed scanner at 1200 dpi. We wrote a Matlab script to analyze and compare the original image with each of the scanned prints. The script scans through the sinusoidal pattern horizontally recording the period of the sine wave as it gets smaller and smaller. We then plotted the period and the squared error of the period curve of the scanned images and the test images. In order to record the period we had to determine a method of measuring the period of a noisy sine wave. After some experimentation with different methods we decided to simply measure the distance between the points where the sine wave crossed zero from positive to negative. This proved to be the most reliable measurement point. We also attempted measuring the peaks of the sine wave by taking a discrete derivative and finding the low points, but this proved unreliable under noisy data.
spatial frequency test image creation code
spatial frequency test image analysis code
Color Resolution
The second test was designed to measure the color resolution that the various printing services could print. In order to measure this we created seven 512x512 test images using a Matlab script. Each test image tested a different color: red, green, blue, yellow, magenta, cyan, or white. Each test image contained a 16x16 grid of 32x32 pixel blocks of color. Starting from the top left and progressing down each row in order, each block dropped by one color value. For example, the top left block of the red test image had an RGB value of (255,0,0). The next block in the top row had an RGB value of (254,0,0) and each block continued dropping on value in color until the last block was black (0,0,0). A similar test image was created for each of the colors listed above. All seven test images, along with the code that created them are linked below.
When the seven test images were received back from each company they were scanned on a flatbed scanner at 300 dpi. We then wrote a Matlab script that measured a mean RGB value for each block. We new that it did not make any sense to compare the RGB values of each block to the original test image because of the nature of the RGB color space, but what we could do is compare the difference between each of the blocks in the printed color grids. If the printing equipment had low resolution color capabilities we would expect that groups of adjacent blocks would have statistically identical mean colors. If the printing equipment had high color resolution each adjacent color block should show a continuous and consistent downward trend.
Color resolution test image creation code
Color resolution image analysis code
Color Context
The third test was designed to test the consistency of a color value when surrounded by different colors in the image plane. To test this we created 36 different test images in Photoshop. All of the test images are linked below. Each image consists of either one or twelve rectangles of either red, green, or blue on a background of one of six different colors.
When we received the prints, each was again scanned on a flatbed printer at 300 dpi. We wrote a Matlab script to measure a mean RGB value of both the background color and the foreground color. We then compared the colors in the prints from each company to see how consistent the color values were, or how dependent they were on the surrounding colors.
Color context image analysis code