EEG Model for Classifying Dominant Images in Binocular Rivalry

EE362/Psych221 Final Project - Winter 2009
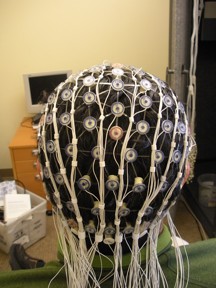
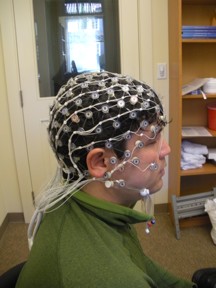
Blair Bohannan and Steinunn Arnardottir


Background
Stimuli
Methods
Analysis
Results
Conclusions
Acknowledgements
References
Appendix
Contact
 
Home

Data acquisition
The experiment was programmed using Neurobehavioral Systems Presentation software. In each trial, one of the eight images was presented onscreen for 750 ms, followed by a 750-ms break with only the fix point on the screen. We chose to leave the image onscreen for this amount of time as it was an adequate duration to produce a classifiable brain signal, and was safely below the length of time of image dominance presented in the relevant literature. Thus, once we enter the rivalry stage of this experiment, we will use a 750-ms time period of each instance of reported dominance for analysis.

Five subjects (3 male, 1 left-handed) participated in the experiment. All subjects reported normal color perception. In order to collect a total of 2400 trials (300 of each stimulus) from each subject, three 20-minute sessions were run for each subject. Within each session, stimuli were presented in pseudrandom order with a balanced design. Subjects were seated in an audio isolation booth, approximately 57 cm from the screen, leading to a correspondence of 1cm/degree of visual angle for the images. Subject task was to attend to the images while keeping the eyes focused on the fix point. Intermittent breaks were given for the subjects to blink or move, the lengths of which were controlled by the subject via keypress.

Data was collected from 128 channels of EEG using the Electrical Geodesics, Inc. (EGI) GES 300 system. Channels were referenced to Cz (vertex electrode). Acquisition sampling rate was 1 kHz; range was 24 bits.

   
net1
net2


Data Pre-Processing
Continuous EEG data was high-pass filtered above 1 Hz to remove DC offset (4th-order Butterworth filter). Data was then lowpass filtered (8th-order Chebyshev Type I) and downsampled by a factor of 16 using MATLAB's "decimate" function. This served three purposes:
1) Reduce size of data set and increase processing speed
2) Remove 60-Hz noise
3) Smooth the data and remove high-frequency muscle artifacts.

The resulting sampling rate is 62.5, with Nyquist frequency 31.25 Hz. Brain waves in the Gamma frequency band are thus for the most part omitted from the classification. Forty-eight samples (768 ms) from each trial are to be used in classification.