Results
MTF
Modulation Transfer Function (MTF) which is a description of the magnitude of the optical transfer function aberration. Only the MTF is analyzed since the phase transfer function is not captured by typical sensors. The following figures are the MTF of the lens systems. Each line represents the MTF of the lens system at a specified field angle.
Digital Camera MTF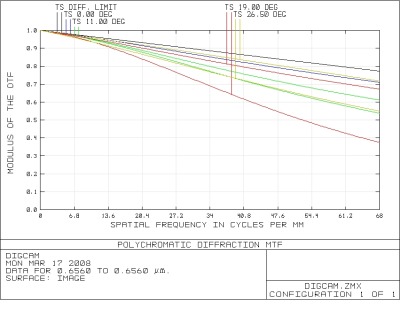
|
Ball CFPA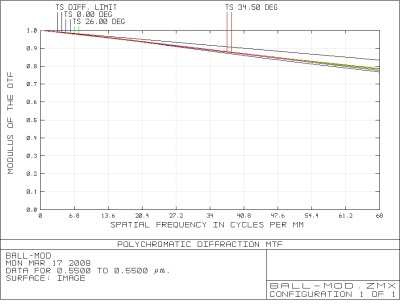
|
In summary the MTF of the Ball CFPA is much better than that of the Digital Camera MTF. This also indicates that we can expect the PSF of the Ball CFPA to be much better than that of the Digital Camera. The PCX MTF is not shown because Zemax was unable to use the data at angles where the spread was too great.
back
Field Curvature
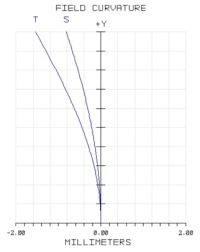
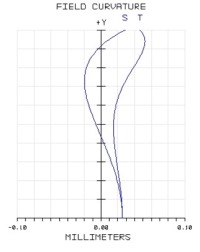
All three field curvatures shown in the figures are taken with a maximum angle of 26 deg. For these field curvatures there is an T (tangential) and S (saggital) curvature. .....
PCX
 |
Digital Camera
 |
Ball CFPA
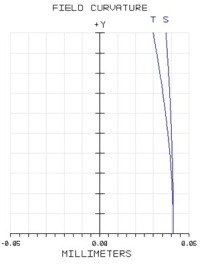 |
For the field curvature of a spherical surface the S and T should not only be equal but also not change curvature. This indicates that there is either an error in Zemax or an error elsewhere.
In summary the quality of the field curvature of the CFPA is much better than that of the PCX and Digital Camera.
back
Relative Illumination (Fall-off)
Relative illumination is often referred to as fall-off. Commonly responsible for the darkness at the edge of pictures. On a planar FPA the relative illumination has a cos^4(theta) relationship where theta is the angle of the raytrace. Because of the cos^4(theta) relationship the focal length of the ray does not match the location of the planar FPA.
This is one of the more general applications of using a curved FPA. A
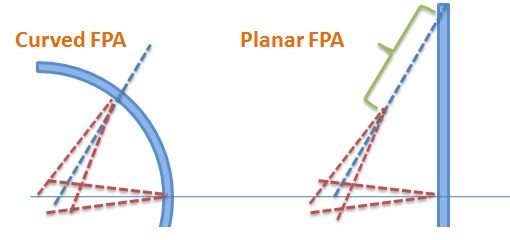
The images below display the results of the relative illuminations from the three types of lenses analyzed in this report. First we can see that the PCX and digital camera immediately start to decrease as the Distance (Field distance proportional to FOV angle) increases. While the relative illumination of the ball CFPA only decreases slightly. As mentioned before this result is expected because of the planar FPA cos^4(theta) relationship while the curved FPA only results in a cos(theta).
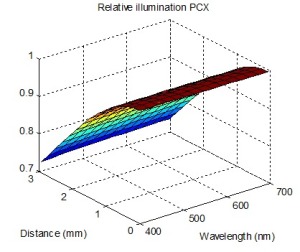
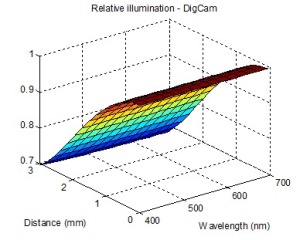
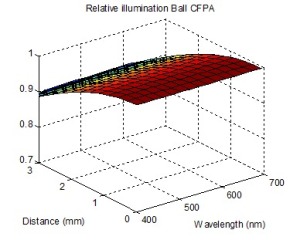
In summary the Relative Illumination or Fall-off of the Ball CFPA is much better than that of the Digital Camera or PCX. This means the Ball CFPA is better suited for stable image capture illumination across the FPA.
back
Field Distortion
Field Distortion is a common parameter to describe lens systems. Often if a system has a large field distortion it will look geometrically skewed. The effect is similar to looking into one of the distorting mirrors in a fun house. Unlike a fun house an optical imaging systems requires as low as possible field distortion.
Definition of field distortion: Field Distortion = ray-trace height ¢ paraxial height
The paraxial height being the height that would occur when aberration vanishes. And the ray-trace height being the height calculated in Zemax using a ray-trace. ā is the focal length.
Symmetrical lens design means no distortion so
ray-trace height on planar surface is
heightÆ = ā tan(theta)
Standard paraxial image height is
height = ā tan(theta)
Since height'=height it would be expected that the field distortion in the spherical lens would be zero.
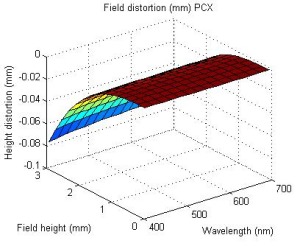
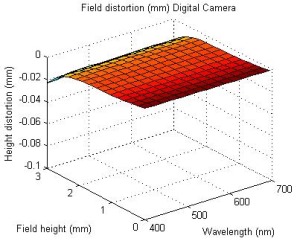
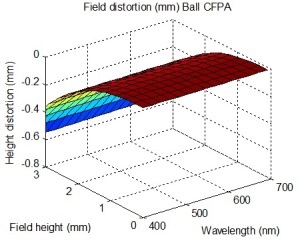
The figures above show that the field distortion of PCX is quite poor. The digital camera on the other hand has been optimized to minimize field distortion but the field distortion of the spherical Ball CFPA is poorer than the PCX by at least x10. This is unexpected and indicates that there is either an error with the prediction or the method of attaining the field distortion.
The diagram below shows how the Zemax output data is incompatible with the information that ISET is expecting to use.
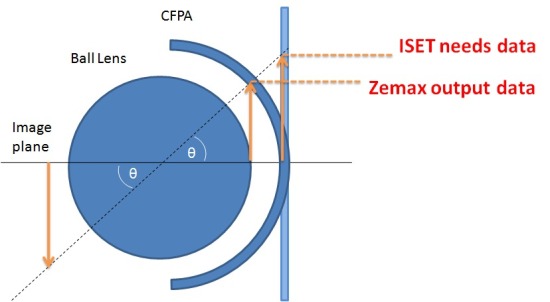
Since this is a purely geometrical difference the fix was easily done in matlab to view the actual field distortion data. diCurved.m The image below shows the correctly defined field distortion information. While the diagram shows much improvement, it still does not match our prediction of zero field distortion. Previous work done by Rim show that using CodeV lens data a zero field distortion was accomplished.
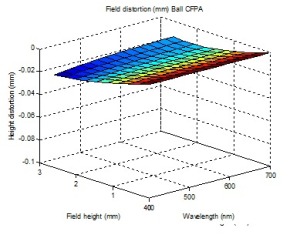
The modified field distribution shows that the Ball CFPA is on par with the Digital Camera. While this result is much better than the previous field distribution it is still much worse than the expected value of zero. While comparing to previous analyzed data from CodeV it is likely that the differences in field distribution is attributed to how Zemax calculates the property. In fact a detailed look into how Zemax process shows that while the calculations of paraxial height is based on the ā tan(theta) it is actually not implemented in that fashion. It would appear that CodeV does infact implement it as ā tan(theta) giving the expected result of zero for field distortion.
In summary the results of the field distortion are inconclusive. While the geometry of the lens system for the Ball CFPA indicated that the results should be zero field distortion, data from Zemax shows that there is in fact distortion on the same order as the Digital Camera. These results do not match the data used from CodeV. Futher investigation into Zemax and CodeV will be required.
back
Point Spread Function
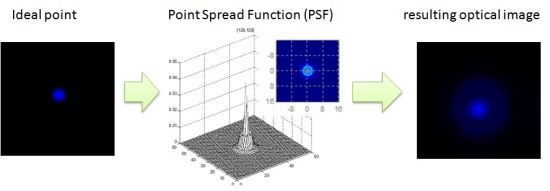
The point spread function (PSF) is function that determines how much a point will spread.
In this section the PSF from FFT and Huygen's technique are compared, as well as a comparison between the Digital Camera and Ball CFPA lens
FFT vs Huygen's PSF
There are two types of PSF available in Zemax. Fast Fourier Transform (FFT) and Huygen's PSF. The FFT PSF is based on several assumptions, which in the case of the PCX we are most concerned with it that the FFT PSF is inaccurate when the ray-trace becomes too spread out. As seen in the PCX lens figure the rays begin to spread immediately. In fact using the FFT PSF the analysis was only able to achieve data for field height of 1.2mm as opposed to what was normally 3mm. The PSF spread is shown in dimensions of micro-meters (10^-6 meter). While field height is in terms of mm.
Fast Fourier Transforms PSF on PCX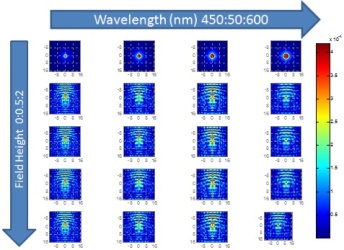 |
Huygen's PSF on PCX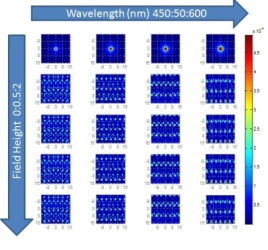 |
One of the advantages of using Huygen's PSF is that it uses the vector of the ray-trace to analyze the PSF. This theoretically should allow for accurate PSF analysis widely spread out rays. The following image is the results of a PSF using Huygen's technique.
While the creation of this PSF data did not result in errors as the FFT PSF, and it also was able to determine the PSF as far as 3mm, the FFT PSF data actually looks better than Huygen's. It is most likely that the distortion of the PCX lens is so poor that at the wide degrees not even a vector analysis is useful.
From these two resulting PSF for the rest of the analysis FFT was used instead.
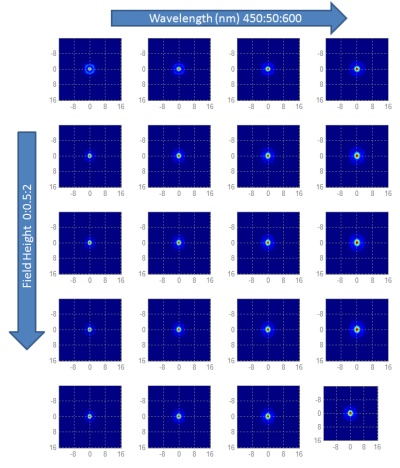
Comparing FFT PSF
The following two figures show the PSF over a range of wavelength and a range of field height for both Ball CFPA and digital camera.
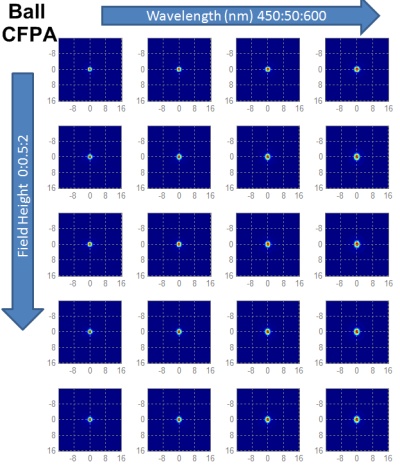
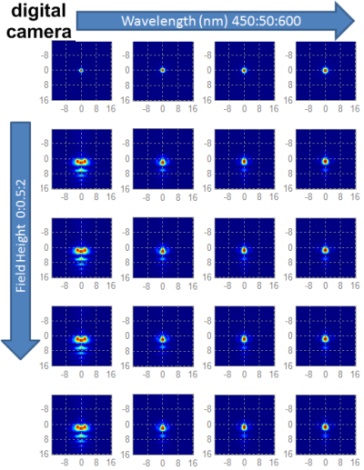
In these images we can tell that the PSF of the BallCFPA is better than the digital camera even when the field height reaches 2mm. But its important to note that digital camera lens system used in these simulations does quite well once the wavelength is above 450nm.
Mesh compare FFT PSF
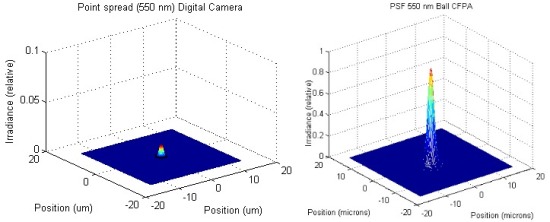
The images seen here are of mesh of the PSF between the digital camera and the Ball CFPA. It can be seen here that the CFPA is 10x better than the digital camera 3 lens system.
In summary the results show that the PSF of Ball CFPA is far superior to that of the digital camera.
back
Optical images
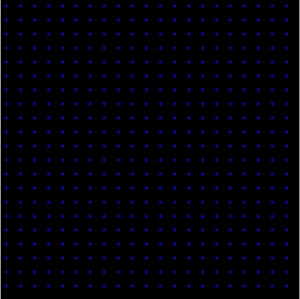
These optical images were simulated using ISET with the PSF data. Each pixel has the PSF applied and simulations take quite a long time. Each image only contains a scene with a single wavelength sampled. It would be ideal for optical image simulations of photon images. For the scope of this project only the arrayed dots at D65 were used.
The optical images shown in this section were taken from the saved optical image files. There are issues with artifacts in Matlab figure images so these images may not represent the actual photon map that the sensor detects. Please refer to the large images available in the appendix for a more accurate image. The .mat data files are also available as a zip file in this section.
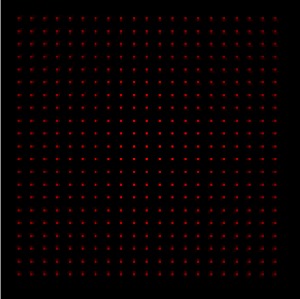
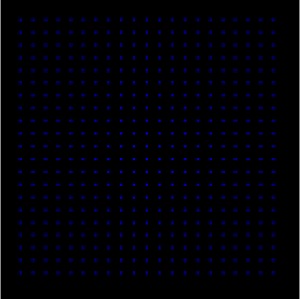
Original Scene images. 6deg FOV
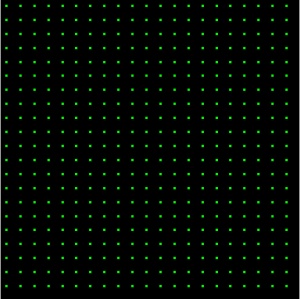
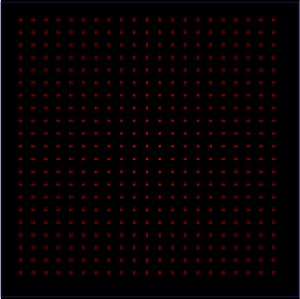
Digital Camera simulated optical images 6deg FOV

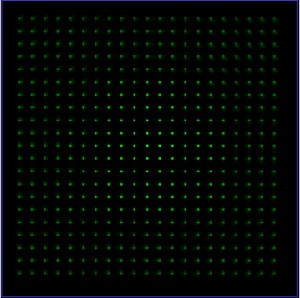
Ball CFPA simulated optical images 7deg FOV


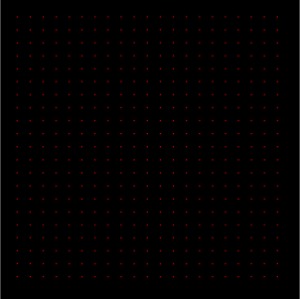
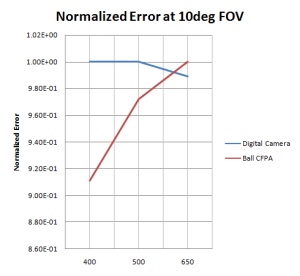
The ball CFPA scenes show components on the psf as well as the illumination fall-off. The fall-off occurs much further towards the edge of the image, which is consistent with the relative illumination analysis. The images are quite difficult to see therefore an error analysis was done to create a better quantitative analysis. These datas are stored in the data files in the appendix.
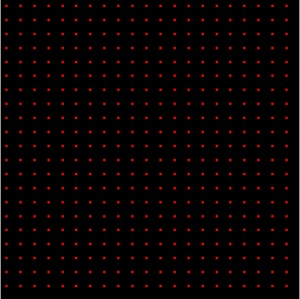
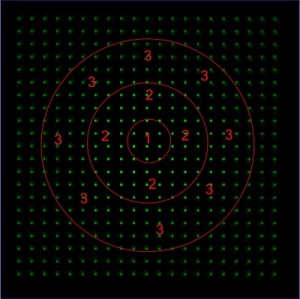
Another interesting optical image to see is the grid D65 pattern. This pattern should allow for the viewing of the field distortion, and effects of the PSF on how lines are sensed. The following is a grid image using PCX, which should have severe fall-off as well as geometric distortion. Though at the 6deg FOV being used by the simulations the distortion should be visible but may not be severe.
PCX grid image
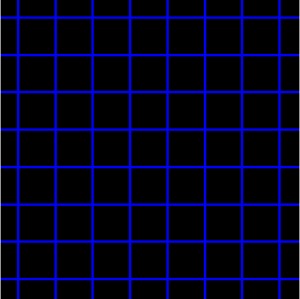
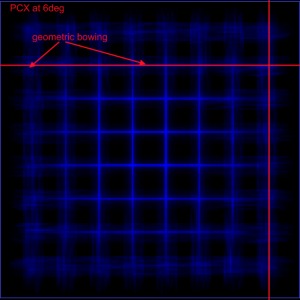
Looking at the images closely it appears as the lines are more of a skew than a bow. This could be attributed to errors in ISET for rotation of the PSF. Improper rotation of the PSF could result in misinterpretation of the images. This is an issue that will be corrected in newer versions of the software.
In summary the results show that the optical image from Ball CFPA is consistently better than that of the digital camera. Quantitative analysis was done through image error analysis with the original scene. Finally the results of this section show that the result of field distortion is not a major component of these 6deg FOV images as shown from the analysis of the PCX psf grid optical image.
back
Geometric Robustness
One interesting question that has not be address previously is how much effect does the accuracy of the CFPA curvature effect the advantages shown for using the CFPA (improved relative illumination, improved PSF). This is not only an interesting question but important since the quality of the fabrication technique has not been perfected yet. While still in development it would interesting to know how much optimization of the curvature is needed to take advantage of the qualities we have demonstrated.
The PSF comparison images below show the BallCFPA with a 20um curvature misalignment compared to the digital camera psf.
Digital Camera simulated optical images. 6deg FOV
20um misalignment Ball CFPA simulated optical images. 6deg FOV

The misaligned ball CFPA scenes show components of the psf as well as the increased illumination fall-off compared to the normal CFPA. In fact when comparing the quantitative error image comparisons the Digital Camera optical images were shown to improve over the misaligned Ball CFPA at 600nm at a FOV of 0deg.
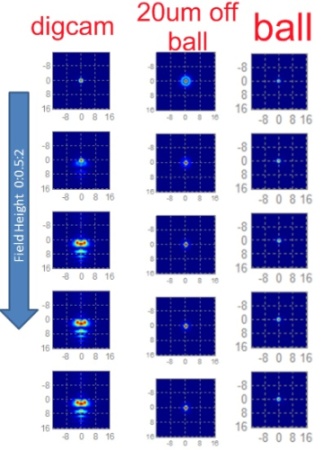
The image below is the misalignment of curvature effect of the actual PSF functions. The PSF that is first effected is PSF at field height of 0mm. This means at an angle of 0deg the PSF starts to become worse. While this is concerning it is can also be shown that it is advantageous for the misalignment to propagate from the center of the image rather than the pariferal. Take the image below as an example of weighting of an errored PSF from the edges matter as opposed to one from the center.
The errors in the peripheral will be weighted much more than the errors of the PSF occurring
It should be noted that a 20um misalignment in standard CMOS fabrication processes is extraordinarily high and absolutely unacceptable. In the case of the inexpensive curving technique proposed by Rim et al, which this work is based on, a 20um misalignment may not be out of the question.
In summary this section shows how the effect of a misaligned curvature of the Ball CFPA lens still provides better optical image results than that of the digital camera. Also it indicates that errors that occur from this type of geometric distortion is tolerable because it propagates from the center of the image while the digital camera distortion propagates from the peripheral.
back