The approach used was to change the entire thought pattern. Now, what would be used is a strategy of finding the number of pixels based on image size. The initial resolution was chosen to be 20 pixels per mm, large enough to see cracks .1 mm wide. Using this technique would require mosaicing.
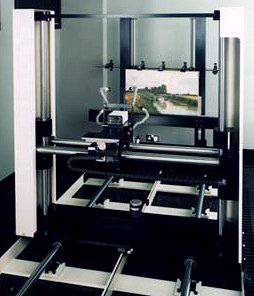
In order to use the method of capturing sub-images and mosaicing them together, it is necessary to have a positioning system that is extremely precise. The camera and a light are attached to a platform. The platform is motorized such that it can move in the horizontal and vertical position. It can be controlled by a computer to move in steps of 5 micrometers in both axes and along a total distance of 1 m.
The lighting system's major change was to place the interference filters in the optical path between the light source and the fibre-optic guide. This was necessary because the interference filters were rather thick, and even the tiniest misalignment could have led to refraction.
A computer controlled the positioning equipment, the light projector and stored the image. The system chosen was a Sun SPARCstation 2GS.
The color co-ordinates were constructed using a tri-stimulus calculation. The CIEXYZ co-ordinate system was the one chosen. The values were calculated using this equation:
(x y z)T = F (c1 c2 c3 c4 . . . c7)T
where each column of F is the function of the filter, and
each row corresponds to x, y, and z respectively.
To generate the least means square solution for the conversion
matrix F, we apply
F = [(MTM)-1MTK]T
where M is the matrix representing each of the n color representations
through the 7 filters:
M =ĀĀĀĀ ĀĀĀĀĀĀĀĀĀĀĀ c11Ā c21Ā c31ĀĀĀĀĀĀĀĀĀĀĀ c71
ĀĀĀĀĀĀĀĀĀĀĀ ĀĀĀĀĀĀĀĀĀĀĀ c12 Āc22 Āc32 ĀĀĀĀĀĀĀĀĀĀĀc72
ĀĀĀĀĀĀĀĀĀĀĀ ĀĀĀĀĀĀĀĀĀĀĀ c1n Āc2n Āc3n ĀĀĀĀĀĀĀĀĀĀĀĀc7n
and K is the matrix representing the X Y Z values for the n colors:
K=ĀĀĀĀĀĀĀĀĀĀĀĀĀĀĀĀĀĀ X1Ā Y1Ā Z1
ĀĀĀĀĀ ĀĀĀĀĀĀĀĀĀĀĀĀĀĀĀĀĀ X2Ā Y2Ā Z2
ĀĀĀĀĀĀĀĀĀĀĀĀĀĀĀĀĀĀĀĀĀĀĀ XnĀ YnĀ Zn
and the conversion matrix found, F, is stored.
The calculation of delE(ab) values are important since they are a measure of color difference. That is important to assess the accuracy of the color measurements and to assess changes in color between images recorded at different times. Another measurement of color difference is the delE(cmc) values. These values give a better indication of human visual discriminating ability. The methods used to calculate these values are discussed later (in the appendix).
1. A white reference
2. A resolution target, something of known size to measure the scanning resolution
3. A color reference, the MacBeth chart
4. A grey scale, used to correct non-linearities in the camera's sensor
First, the painting is mounted on the same plane as were the calibration charts. The portal is placed by hand to give the approximate number of pixels that will be required. While still maintaining a uniform distribution of light, the light sources are set to the highest illumination possible.
To focus the camera, a section of the painting is placed under green light from a filter with maximum transmittance of 550nm. The sharpness is measured and the position that maximizes the sharpness is chosen. After of this has occured, the automatic acquisition program ACQUIRE is started. ACQUIRE automatically makes measurements from the resolution target. It then decides where to place each of the sub-images, as well as the amplification level.
1. The image of the white target is used to calibrate the image. This is done to correct for the non-uniformity of light.
2. The grey level chart is analyzed. Seven tables are generated based on this. These are necessary because of the response of each filter is different in respect to the spectral power distribution of the light. The remaining images are corrected.
3. A color-conversion matrix is generated using the procedure in number 2, and a color conversion matrix is produced.
4. The Macbeth chart is converted to XYZ space. The difference between actual and measured is calculated. The average difference is used as a measure of calibration accuracy.
From there, each sub-image is converted to XYZ space.