Holographic Imaging and Stereo Perception
Using 2-D Images to Create 3-D Perceptions
Psych 221:
Visual Imaging Systems
March 2008
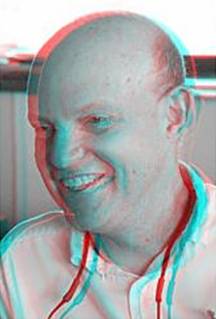
Anaglyph of Prof. Brian Wandell, Stanford University.
Courtesy Center for Multi-Disciplinary Teaching and
Research.
In this paper, I study several methods of presenting a 3D image on a 2D
viewing surface. The production of these
types of 3D images represents few technological challenges, but the drawbacks
inherent in using 2D surfaces to present 3D information suggests the need for
more sophisticated viewing devices. I
conclude with a brief discussion of other possibilities in the field of 3D
imaging, either using 2D viewing surfaces or other means, and its significance
to the future of the display industry.
Introduction
At the moment, display technology is quickly
approaching a fundamental limit: the ability of the human eye to see fine
detail. As technology giants like
Samsung and Panasonic achieve higher and higher densities of pixels within
their flat-panel displays, the display industry faces the problem that
resolution scaling will no longer make a difference to human perception.
The standard limit of human perception is
approximately 300 pixels per inch, or PPI.
PPI is an absolute measure of display resolution that is independent of
the size of the monitor. Therefore, a 2”
cell phone screen with 600x600 resolution and a 72” TV screen with 17280x12960
resolution both exhibit 300 PPI (Fig. 1). Building a smaller cell phone display or
increasing the TV screen’s resolution will yield no benefits to the end-user,
because the human eye will sense no difference in resolution past the current
point
Figure 1. The sizes of a cell phone screen and a flat-panel TV screen, both of
which have the same PPI.
Cell phone courtesy BuyCellNow.com; TV courtesy Taume.com.
Modern displays have already reached the boundary of
human perception. In 1988, IBM released
the VGA standard, with resolutions at or under 60 PPI. By the late 1990’s, however, display
technology had undergone a revolution: graphics hardware were dedicated
devices, instead of subcomponents of the main processor. With more memory and processing resources
available, displays began to rapidly offer more resolution, with the industry
passing 100 PPI in 2000 and exceeding 200 PPI by 2003 (Fig. 2). Devices claiming
over 300 PPI began to appear in 2005, finally exceeding the ability of some end
users to perceive the difference.
Figure 2. The acceleration of display resolutions
leading up to the crossing of the human perception barrier. Compiled with product information from Pixels Per Inch entry in Wikipedia.
Although not all devices have attained resolutions of
300 PPI or greater, the display industry has been largely driven by the
continued scaling of LCD and plasma technology to greater and greater pixel
concentrations. This trend has fed the
growth of other sectors: the graphics hardware industry has kept pace with the
display market, offering higher and higher performance to meet the larger
demands of high-resolution screens. A
limit to that scaling, whether technology-related or market-related, would
seriously affect the entire technology industry. Thus the question that will become more and
more important in the next five to ten years is, How will the display industry
continue its progress when scaling no longer produces more attractive
products?
It is impossible to foretell the future of display
technology, but the most obvious next step is to move from 2D displays to
displays capable of delivering the perception of 3D – whether through a
modified 2D surface, or through a device actually capable of creating 3D images
(a so-called ‘hologram’ projector). The
discussion of such devices and the science that would enable them is beyond the
scope of this paper, but a solid understanding of human perception and the
methods that can be used to ‘fool’ the human eye into perceiving 3D can help
enlighten our perspective of the future of displays. The goal of this paper, then, is to introduce
several of the methods of 3D imaging through 2D surfaces, and the drawbacks to
these methods that will need to be overcome in future display technology.
Methods
The human visual system
utilizes several methods to perceive depth, and creating the illusion of depth
on a flat surface will require an algorithm that satisfies one or more of these
properties. Although the human visual
system processes sight in many different ways – both in the eyes and in the
brain – the primary methods of depth perception are listed below (Purves 2003; Steinman 2000).
·
Parallax, also known as binocular vision, is perhaps the most fundamental of the
methods. Because a human’s two eyes
perceive slightly different images, the brain can compare the data from the
right eye and the data from the left eye and determine not only the position of
objects, but also their relative positions, to a high degree of accuracy. In addition, because the two eyes both point
toward the same object, the brain can use the eyes’ angles to estimate the
distance of the object currently in focus.
·
Color vision allows the eye to perceive
differences in lighting, which can be used to determine the relative positions
of objects.
·
Occlusion involves perceiving nearer objects
between the viewer and farther objects, by the basic fact that nearer objects
occlude more distant objects.
·
Perspective refers to the property of parallel
lines appearing to converge at very far distances. The visual centers can use this information
to evaluate the relative distances of objects, especially in landscapes.
·
Lens focus involves the physiological ability
of the eye’s lens to judge where the current focus is. This data helps determine the distance
between the viewer and the current object in focus.
Even by limiting our study to the five properties
listed above, it would be difficult to create an algorithm that tricks the eye
in all of these methods, especially with a flat display. However, work by renowned psychologist and
neuroscientist Bela Julesz demonstrated that tricking a viewer’s eyes into
perceiving parallax was enough to create the illusion of depth. In his 1971 book The Fundamentals of Cyclopean Vision, Julesz introduced the ‘random
dot stereogram’, in which an image is ‘encoded’ in a collection of random
dots. Although these stereograms were
not particularly useful for accurate 3D representations, they demonstrated the
use of certain techniques – mainly parallax – to trick the eye into perceiving
depth on a 2D surface. Julesz’
stereograms led to the invention of other stereograms, including the red-cyan
anaglyph and the auto-stereogram seen in many cartoons. These stereograms provide the basis of this
paper’s discussion of 3D imaging and its science.
Because we aim to achieve parallax using a 2D image,
we first investigate the phenomenon of parallax in normal vision. An object in space will appear to be roughly
the same size and shape to both eyes, but its position against a background –
especially a far-away landscape – will be remarkably different (Fig. 3). The visual center compares the position of
the foreground object with the background, and makes an appropriate calculation
about the object’s distance from the observer.
Thus the horizontal distance between the object in the left eye view and
the object in the right eye view provides the basis for a fundamental method of
depth perception.
Figure 3. Parallax involves the left eye and right eye receiving different images of the same object. The background remains nearly constant, but the object’s location relative to the background differs significantly between the left and right eyes. From the difference, the visual core can calculate fairly accurately the distance between the immediate object and the background.
Unfortunately, creating
an image in 3D through parallax cannot be done by standard viewing
methods. Since the eyes view the same
image, the visual center does not calculate a difference between the left and
the right eyes, and the image fails to create the illusion of depth (Fig. 4). Essentially, the calculated distance between
the object in the left eye view and the object in the right eye view is 0, and
the object is considered coplanar with the image background.
Figure 4. A 2D image cannot deliver
the illusion of depth through parallax by any normal means.
We require a method of
delivering different images to each eye, such that the object appears against
different backgrounds even when the image is still flat (Fig. 5).
Figure 5. A successful stereogram will create the illusion that the right eye and
left eye are seeing two different images, though the actual 2D image remains
the same.
One simple way to
deliver separate images to each eye involves literally dividing the eyes
between two different images. This form
of 3D imaging, called stereoscopic
imaging, requires a method of forcing the eyes to view two different
targets, either through the use of a divider or by using narrow images that the
human observes at very close range (Fig.
6). This form of 3D imaging offers
the advantage of delivering information not only through the individual images
but also through their combination, allowing the user to receive twice as much
visual input as through a single image.
Figure 6. Stereoscopic imaging requires that the eyes view two different targets
with slightly different images.
Unfortunately,
stereoscopic imaging requires that the viewer focus on two separate objects at
the same time: the right eye on the right image, and the left eye on the left
image. Although this way of observing is
certainly possible for most individuals, it is rather unnatural because the
human visual system does not normally focus on images at infinity. Prolonged viewing of such images causes
fatigue, as the eyes struggle to maintain an unusual focus.
Figure 7. A simple stereoscopic image with the shack in the foreground horizontally
displaced.
Figure 8. Stereoscopic image with gridlines.
The shack has been displaced slightly in the horizontal direction.
Julesz introduced a simple and effective way
to naturally create the illusion of parallax.
Using glasses with colored lenses, one can force each eye to see a
limited range of colors
The color-separated
stereogram later evolved into a more resolution-friendly stereogram called the
anaglyph. In a typical anaglyph, two
images taken from slightly different horizontal perspectives are merged into
one. The left image is translated into a
monochrome image using only the color of the left lens (usually cyan), and the
right image is translated into a similar image using only the color of the
right lens (usually red). Thus the same
image appears differently to the two eyes, creating the illusion of depth (Fig. 9).
Figure 9. The anaglyph image uses two different color channels to differentiate the
left eye view from the right eye view.
The anaglyph image offers a more
natural viewing experience, as the eyes focus on a target at finite
distance. Thus an anaglyph more
effectively delivers the illusion of depth, although this process comes at the
cost of color information: the full range of colors is sacrificed to divide the
image between the left eye and the right eye.
Yet in the interest of learning more about delivering different images
to each eye using the same image, we will further investigate the nuts and
bolts of creating anaglyph images.
It is not always necessary to use two
different images to create an anaglyph.
In the following section, a single image is shifted to the right and to
the left, colorized, and then recombined into the anaglyph (Fig. 10). Our interest lies in developing a more
sophisticated method for creating an anaglyph out of a single image, with the
goal of creating an algorithm to create a convincing illusion of depth using
any digital image.
Figure 10. The process used to create an anaglyph out of a single image. Although not as effective as using two
different horizontally-displace images or as exact as using an image with depth
information, we will see that this process is fairly successful at inducing the
illusion of depth.
Results
The following images were created using custom Matlab
scripts developed specifically for creating single-image anaglyphs. These scripts, available for download in the Appendix
section, accept and
return JPEG images. As discussed under
the Matlab Files
heading, each script includes several settable parameters that the reader is
encouraged to adjust in order to achieve best image quality. For the images below, the parameters were set
to the values in the downloadable files.
First, we would like to examine how the random dot
stereogram works, and then generalize it to more accurate reproductions of
original images. In Julesz’ original
random dot stereogram, an image was fed to an algorithm that would reproduce
several times in the horizontal direction, but shifted slightly with each
repetition. A viewer wearing 3D glasses
would perceive the shifting pattern and see a depth illusion of the image
popping out at him/her. In the Matlab
script randomdot.m, the algorithm is different but the effect is the same: the
image is shifted within its own frame, and the random dots tend more towards
the 3D glass lens color wherever the intensity of the original image exceeds
the threshold (Fig. 11).
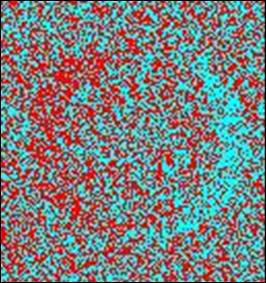
Figure 11. An original image of a circle, and the random dot stereogram of that
image using the algorithm in randomdot.m.
The circle’s outline is clearly visible when wearing 3D glasses.
As interesting as random dot stereograms may be, they
sacrifice a significant amount of information for the sake of random dots. In most imaging technology, we want to
transmit as much relevant visual data as possible to the viewer – not random
dots. The limits of random dot
stereography become apparent when the process is used with more complicated
pictures – for example, the street photo in Fig. 12. Object edges appear
clearly in the stereogram, but all of the color information and much of the
texture information has been lost in the translation process.
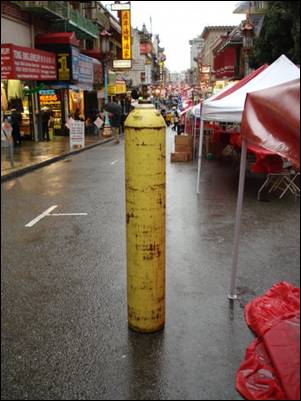
Figure 12. A street scene with several abrupt features, and the corresponding
low-quality random dot stereogram.
Because so much data is lost in the randomization process,
we would like to build on the fundamental ideas of random dot stereography to
create a more effective 3D imaging process.
In an anaglyph, we generalize the random dot algorithm such that there
is no scattering or randomness, creating a much more appropriate image. The simplest of the anaglyphing scripts,
named anaglyph.m, executes the process depicted in Fig. 10 using a shifting algorithm.
The original image, a horse running along the beach (Fig. 13), is turned into a grayscale
image and shifted to the left and to the right.
Because we have set the threshold below 255, the lighter pixels (such as
the clouds and the waves in the ocean) are not shifted. The primary shifting occurs on the dark edges
of the horse, and on the outline of the rocks in the upper right corner.
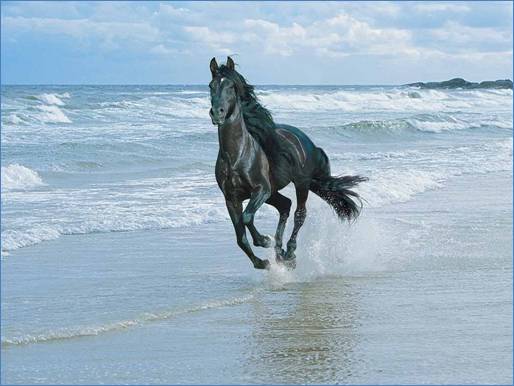
Figure 13. Original image of a horse running along a beach, with a good array of light
and dark colors.
The resulting anaglyph demonstrates a fairly
high-quality anaglyph (Fig. 14). To the naked eye, the horse seems to be
rather fuzzy, but when viewed with appropriate 3D glasses, the horse moves out
from the page and seems to be running toward the viewer. Although the entire image has been turned
into an anaglyph, only the horse seems to float in space thanks to its dark
outline. One may also notice some color
separation around the rock outcropping, but because the outcropping is mostly
flat, the effect is barely noticeable – a good thing, since it is part of the
background and should therefore be treated as a 2D object.
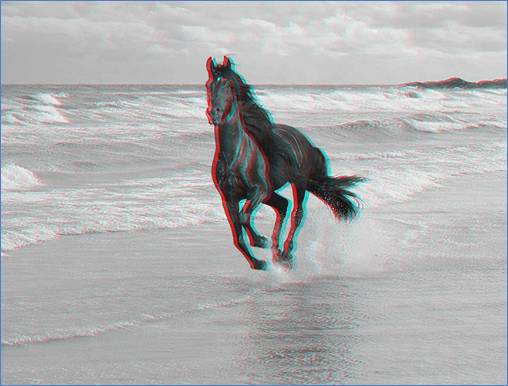
Figure 14. Anaglyphed image of a horse running along a beach.
This simple anaglyping method executes quickly and
creates a decent image. However, the
image must contain a clear, dark focal point in the foreground and an obscure,
bright background for the resulting separation to produce a sharp illusion of
depth on the main object and not on the other objects – such as the
background. Therefore this method
suffers from the main drawback of uniformity: the formula does not distinguish
between foreground and background images, and therefore the anaglyphed image
can potentially confuse the viewer by creating the illusion of nearness on
objects that are far away.
For example, let us consider an image less conducive
to anaglyphing by this method: the landscape from Fig. 6 and Fig. 7, which
features a larger range of objects in the foreground and background (Fig. 15). In a true anaglyph composed of two images
captured from separate vantage points, the shack would undergo major color
separation, while the somewhat distant trees and church steeple would receive
far less separation. Finally, the
mountains in the background should be exactly the same in both images, because
they will appear at the same locations for the small horizontal displacement of
two eyes.
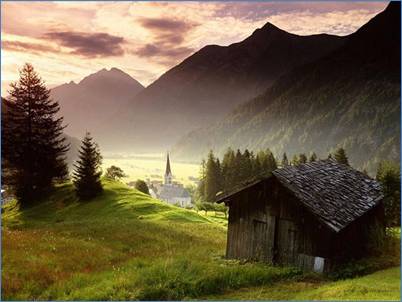
Figure 15. A landscape with a greater range of foreground objects, and a background
with dark objects as well as light ones.
However, several aspects of the image cause artifacts
to arise during anaglyphing (Fig. 16). Although the shack is dark, the mountains in
the background are rather dark as well and therefore will receive a significant
amount of separation. In addition, the
trees and the church steeple near the background will receive the same amount
of separation as the shack, which does not reflect the relative distances in
the scene. These artifacts confuse the
viewer: too many of the objects in the image appear to be close to the viewer,
and the intended effect of creating the illusion of depth is overrun by too
many objects appearing in 3D.
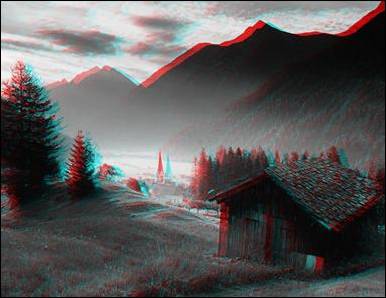
Figure 16. The anaglyphed landscape contains too many separations that overload the
viewer with 3D objects. Even the
background has been color separated.
The anaglyph algorithm in this case faces a
fundamental problem: it is attempting to create an anaglyph of an image for
which it has no depth information. One
might theoretically update the Matlab script to use depth information about an
image to control the separation distance for each object, but most pictures do
not include their own depth information.
A more practical way is to permit the user to provide cutouts of the
foreground objects, and to superimpose the anaglyphs of those objects onto a
separate background image.
Therefore, in a slightly more sophisticated anaglyph
creator called twolayer.m, the user can specify a foreground
image and a background image that will be used to create an anaglyph. Since the artifacts in the previous anaglyph
were caused by objects in the background, a cutout of just the shack can be
used to indicate the area to be anaglyphed (Fig. 17).
Figure 17. The original landscape image will be used as the background, and a cutout
of the shack will be used as the anaglyph portion of the image.
The anaglyph process proceeds identically to the
process in anaglyph.m, but the background receives no color separation (Fig. 18). The outlines of the shack are particularly
strong because of the edge feathering from image preprocessing. Although the amount of edge emphasis can be
adjusted using the threshold parameter, a stronger edge results in a more
identifiable foreground image.
Figure 18. The background only undergoes monochroming, while the foreground image
goes through the anaglyphing process discussed in the Methods section.
Finally, the images are recombined to create the final
anaglyph (Fig. 19). The background does not receive any
anaglyphing, but the shack will be clearly visible to a viewer wearing 3D
glasses. Thus the two-layer process
creates a more effective depth illusion than the simple anaglyph from the
previous example.
Figure 19. The final two-layer anaglyph, with the shack’s proximity to the viewer
emphasized.
Unless one utilizes a distance finding program to
determine the relative locations of objects in the image, this method will
offer fair performance for minimal preprocessing. Even while the color information has been
lost, the image still offers fair resolution, and the illusion of the shack’s
proximity to the viewer satisfies our primary goal of tricking the viewer’s
sense of depth.
Conclusions
As mentioned before, anaglyphs still do not represent
the perfect solution to 3D imaging using 2D displays, because anaglyphs
sacrifice color information in favor of depth representation. In addition, a true anaglyph that accurately
depicts the distance of various objects would require a significant amount of
information that a typical image capturing device does not typically
provide. Finally, anaglyphs require that
the viewer wear special glasses, which inconveniences the viewer and will
likely not appeal to large markets. For
these reasons, anaglyphs will probably not dominate the display market in the
future.
However, the study of anaglyphs reveals some
interesting truths about the world of 3D imaging. To create the illusion of depth on a flat
surface, the designer must either increase the amount of information available
to the viewer – as in the case of stereoscopic imaging – or sacrifice chromatic
information – as in the case of anaglyphs.
Thus we might generalize our findings by stating that the maximum amount
of information that a 2D image can deliver to a human observer is the number of
discrete pixels multiplied by the properties those pixels can have, either in
the color domain or in the depth domain.
This limit indicates that we must investigate other ways of exploiting
flat displays.
One possibility revolves around a more sophisticated
application of the anaglyph process. An
anaglyph depends on 3D glasses to ensure that each of the viewer’s eyes
receives a different image. However, if
the image were displayed electronically, it could rapidly switch between
displaying the left frame and displaying the right frame. To ensure that the correct eye receives the
information, the viewer would wear a pair of glasses with simple LCD filters on
the lenses. These filters alternately
blank the left and right eyes, and are synchronized with the display such that
the viewer sees a parallax image.
Another possibility utilizes a textured screen surface
to present different images to each of the viewer’s eyes. The main drawback to such a system is the
need to track the viewer’s location relative to the screen, as the texture must
reposition each of its facets to ensure delivery to each of the viewer’s eyes.
Ultimately, actual 3D projection remains the most
likely solution to the possibility of depth-based imaging. A hologram machine solves the problems of
parallax, color, motion, and perspective all at the same time, while
sacrificing none of the information needed to create an image as rich and
high-resolution as today’s flat displays.
The major question is what physics would allow designers to project
light into free space. The answer to
this conundrum will be a major focus of display technology in the near future.
The world of display technology will undergo a
revolution in the early 21st century. The advent of true 3D vision is not far off,
and its roots will be in our understanding of human vision today. We look forward to the exciting new
technologies that await us on that road.
References
Chastain, Sue. PPI - Pixels per Inch. 2008.
19 March 2008 <http://graphicssoft.about.com/od/glossary/g/ppi.htm>.
D. Purves, B. Lotto. Why We See What We Do: An
Empirical Theory of Vision. Sunderland: Sinauer Associates, 2003.
Julesz, Bela. Foundations of Cyclopean
Perception. Chicago, IL: University of Chicago Press, 1971.
Steinman, Scott B., Barbara A. Steinman and Ralph P.
and Garzia. Foundations of Binocular Vision: A Clinical Perspective.
McGraw-Hill Medical, 2000.
Appendix
Includes downloadable files.
Final Presentation
Powerpoint Presentation (.pptx format)
Powerpoint Presentation (.ppt format)
The Powerpoint presentation used to
deliver the final report for this class.
Mainly contains example images used to describe the anaglyphing and
stereoscopy process.
Matlab Files
These Matlab scripts were used to
generate the stereograms in this report.
Note: to run
the scripts, you will need to download the Conversion Files as well and save them in the same directory as the Creator Files.
All Creator files exhibit the same functionality: the user provides the
name of a local image (or two, in the case of the Two Layer Stereogram
Creator), and receives the image data for an output file in JPEG format. All Creators also offer several set parameters
within the code, which are currently set at the levels used to create the
images in this report.
·
x variation – the horizontal distance between
the left and right images, which determines the amount of parallax the viewer
will see.
·
y variation – the vertical distance between the
left and right images, which adds a certain amount of skew to the image
(although does not directly affect parallax).
·
intensity threshold – the pixel intensity above which a
point will not be converted into the anaglyph image. Set to 255 for a full conversion, or low for
a less intense anaglyph.
·
dot scattering – the concentration of dots in the
separated images. Set to 0 to maximize
concentration, or less for a spottier distribution.
·
3D-eyeglass lens colors – the colors of the left and right
lenses of the 3D glasses used by the viewer.
Both parameters are vectors of the form [RED GREEN BLUE], with values
for each element ranging from 0 (no content) to 1 (full content). A brief list of colors:
o
cyan
(left default value): [0 1 1]
o
red (right default value): [1 0 0]
o
black : [0 0 0]
o
white : [1 1 1]
See code documentation for more information.
Creator Files
Creates a simple anaglyph using an input
image.
Random Dot Stereogram Creator (randomdot.m)
Creates a sample random dot
stereogram using an input image.
Two-layer Stereogram Creator (twolayer.m)
Creates an anaglyph using a
foreground image and a background image.
The foreground image is turned into an anaglyph and superimposed over a
grayscale version of the background image.
This allows for more sophisticated anaglyphs that differentiate between
foreground and background.
Conversion Files
Color to Grayscale (color2gray.m)
Converts the data from a color JPEG
image into a grayscale JPEG image with 3 color channels. The resulting matrix has the dimensions [height
width 3].
Color to Shadow (color2shadow.m)
Converts the data from a color JPEG
image into a grayscale JPEG image with 1 color channel. The resulting matrix has the dimensions
[height width 1].
AJ Minich,
March 2008