Spectral response function
1) Background
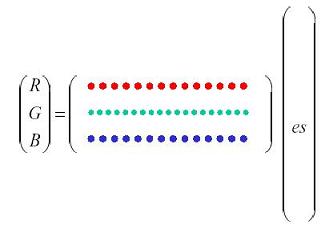
The spectral response function is the spectral sensitivities of the digital camera’s RGB sensors to incoming light. By characterizing the Nikon D70’s red, green and blue sensor sensitivities, it allows the R, G or B value of any pixel to be calculated from any given spectral content of light (es) falling on the sensor, as shown in Figure 1. This sensor sensitivity can also be entered into the ISET simulator to customize the simulation for the Nikon D70.
Figure 1. Spectral Response Function
2) Methods
We used a white-light source and the monochromator to generate a sequence of narrow-band optical input signals, with the center frequencies of the narrow spectral bands set and varied via MATLAB.
We then measured the output average spectral radiance with the Photo Research PR-650 spectroradiometer. The PR-650 is a portable, spectrally-based radiometer and performs a complete, NIST-traceable spectroradiometric measurement from which photometric and colorimetric quantities are calculated. The spectroradiometer data was accessed via MATLAB to verify that the output matched the desired spectrum. This was done for 35 center wavelengths, from 400 nm up to 730 nm in increments of 10 nm.
We placed the Nikon D70 in front of the monochrometer with the lens removed and captured images in raw .NEF mode for all 35 wavelengths with a trial exposure length setting. We then checked that none of images were saturated to confirm that we did not need to repeat the image capture at a shorter exposure setting.
We used MATLAB to read in the raw image data and found an average R, G and B pixel value for each of the 35 images. This set of 35 RGB values and the corresponding light spectra obtained from the spectroradiometer was then used to estimate the sensor spectral response using singular value decomposition (SVD).
3) Results
The spectra of the 35 narrow-band light as measured by the spectroradiometer are shown in Figure 2.
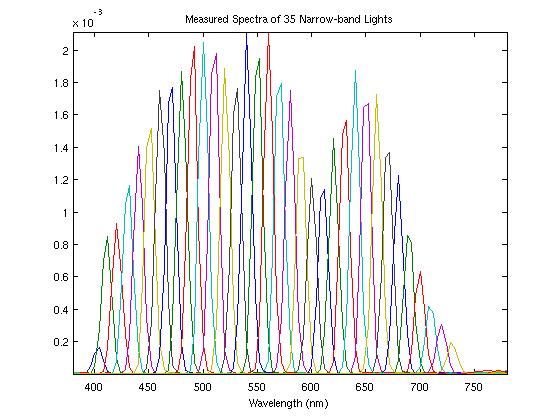
Figure 2. Measured Spectra of 35 Narrow-band Lights.
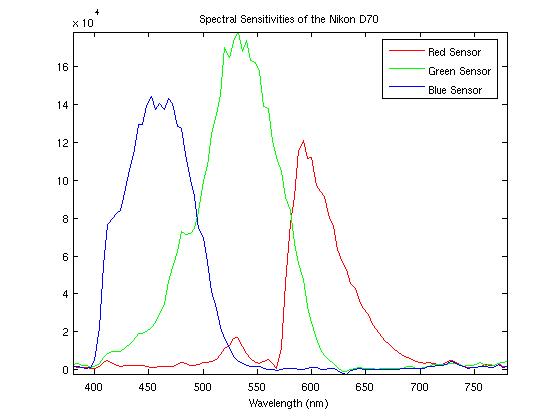
Figure 3. Nikon D70 Sensor Spectral Sensitivities.
The spectral sensitivities of the red, blue and green sensors of the Nikon D70 are as shown. We observed that the three sensors generally corresponded to the expected red, green and blue spectra, and the green sensor was more sensitive than the red and blue sensors because it contained the luminance component.
It was also interesting to note that some of the spectral sensitivity functions went below 0, which would not have been physically realizable. This is most likely the result of noise both in the measurement process as well as the sensors themselves.
Next: Other Observations | Home