Other Observations
Sensor Linearity with Intensity
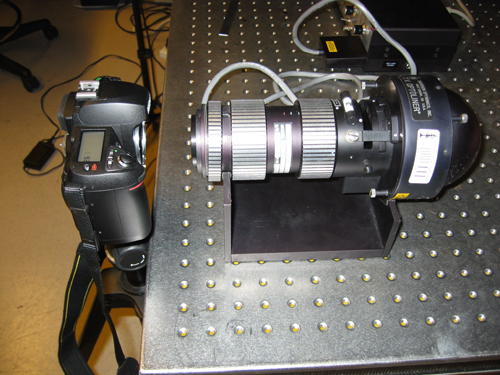
We verified that the pixel values obtained in the raw data was linear with light intensity falling on the sensors by placing the Nikon D70 with the lens removed in front of the optoliner. We used a light collimator to focus the optoliner light, producing a circular region of light on the image.
Figure 1. Optoliner and Camera Set-up
We then took photographs at varying intensities of light from the optoliner, and averaged the pixel values in the region of the image where the optoliner light was falling. We averaged across all four RGBG channels in the image for simplicity, and obtained Figure 1, which indeed shows that the raw pixel data varies linearly with light intensity.
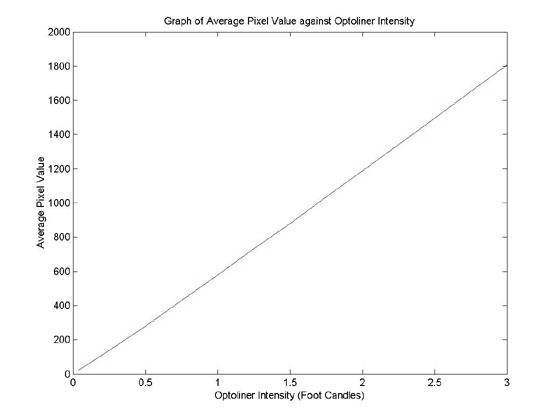
Figure 2. Graph of Average Pixel Value against Optoliner Intensity
Saturation Level
The Nikon D70 captures images at 12 bits per pixel, but during conversion into the compressed raw .NEF file, the digital values of pixels are converted into an 11-bit range, from 0 to 2047. In order to verify this, we used a long 5 second exposure to saturate all the pixels, and subsequently read out the pixel data in the .NEF file.
During this procedure, we observed an abnormality in one column of the CCD sensors. In the 2014 by 3040 CCD array , 2014 sensors in the 3040th column did not saturate at all, having a mean value of 124.9 (out of 2047), compared to the image mean of 2046.
We noticed the same abnormality in the dark pictures taken with the lens cap on, where the mean of the column in a sample frame was 94.8, compared to the image mean of 2.68.
![]()
Figure 3. Diagram of Location of Abnormal Pixels
Next: Macbeth Color Checker | Home