Macbeth Color Checker
Background and Procedure
1) Background
Having measured a variety of the Nikon D70’s characteristics, we wanted to verify the spectral response function that we had measured, by testing it on actual scenes. We picked the Macbeth Color Checker because it is a standard test pattern of 24 different colored squares.
We processed the data that we obtained via ISET, which is collection of software modules written in MATLAB for simulating an imaging system, developed primarily by Professor Wandell.
2) Experimental Procedure
We had two basic set-ups:
· Macbeth Color Checker illuminated with a tungsten lamp
· Macbeth Color Checker illuminated with a tungsten lamp and blue filter
Images were then acquired using the Nikon D70 in raw mode as well as JPEG Fine mode. The JPEG Fine mode is the lowest compression JPEG mode, with a compression ratio of 1:4. The aperture was set to f4.5 and an estimate exposure length was automatically metered by the camera. We then took two shorter exposure lengths (underexposed) and one longer (overexposed) for bracketing purposes. 3 images were taken for each of the settings.
The exposure settings were:
|
Lighting |
Over |
Metered |
Under |
Under |
|
Tungsten |
1/640 |
1/800 |
1/1000 |
1/1250 |
|
Tungsten with blue filter |
1/80 |
1/100 |
1/125 |
1/160 |
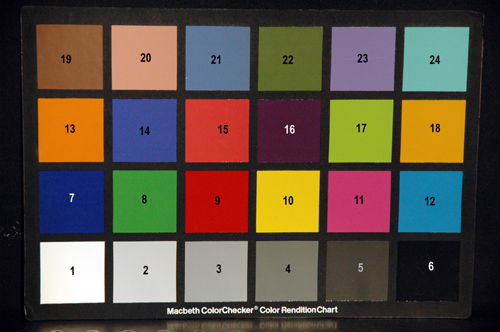
In each lighting setting, we also measured the reflectance off each square of the chart with the Photo Research PR-650 spectroradiometer, taking 3 readings per square. The order of the squares is indicated in the numbered chart (Figure 1).
Figure 1. Numbered Macbeth Color Checker
The raw data and JPEG images were loaded into the ISET, and using the region-of-interest selection tool, the mean and standard deviation values were obtained for each of the 24 squares. The final analysis was done on the images taken with longest exposure, and the image and spectral data was averaged over the repeated measurements.
3) ISET
The ISET simulator was used in the analysis of the acquired raw data and JPEG photographs. We wrote MATLAB scripts that adjusted our data to be loaded into ISET, and functions that allowed us to select regions of interest (ROI) in the raw pixel data and JPEG images that we loaded in. In this manner, we acquired data on the mean values and standard deviations of the selected region in the RGB channels.
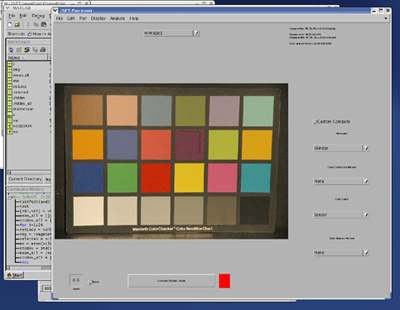
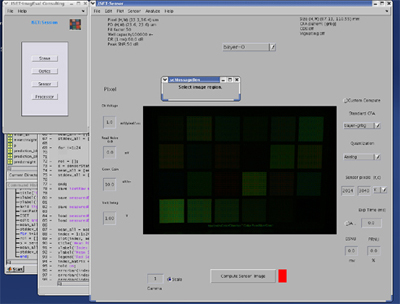
Figure 2. Screenshots of ISET Usage in JPEG and Pixel Data Analysis
We originally intended to also run a simulation of the Nikon D70 through the ISET to compare the simulated raw and JPEG images with what we measured. However, due to the constraints of time and the significant processing requirements for a full 2014 x 3040 pixel simulation, we opted to do a more direct simulation using our estimated sensor spectral sensitivities. Nevertheless, we did experiment with modifying and loading in our sensor spectra as color filters into ISET.
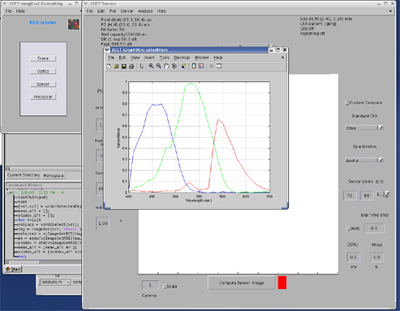
Figure 3. Screenshot of Spectral Response Function Estimate in ISET
Next: Analysis and Predictions | Home