All in all, our group designed and performed three separate sets of experiments. The first set involves photographing the Macbeth chart under a variety of illumination conditions to see how well our digital cameras perform under subtle and extreme lighting changes. Please refer to a separate report for the details of this experiment.
In this report, I am primarily interested in our second and third sets of experiments, which attempt to reveal the nature of the color-balancing algorithm used by our digital cameras. Our goal is to see if the camera was using the gray world assumption, the perfect reflector assumption or a combination of the two to color-balance its image data. Basically, these experiments involve generating a test pattern on a computer display and taking a picture of that pattern with the camera. We then use matlab to analyze the bitmap files produced by the camera software. Let's examine the details of these two experiments in turn.
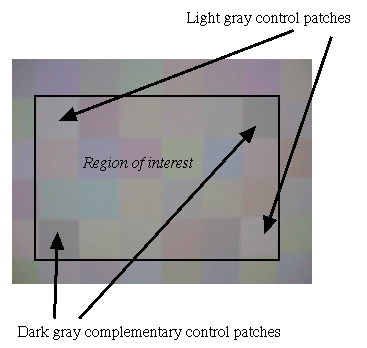
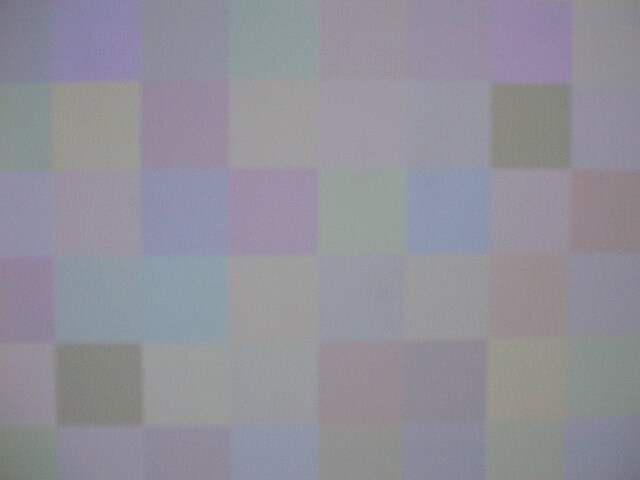
We generate our test patterns using two matlab scripts (makegray44.m, testpattern.m) which I wrote specifically for this purpose. Each test pattern consists of a 6x8 grid of 48 colored squares. We use makegray44.m to produce 44 colors which average out to a user-specified gray value; testpattern.m then takes in these colors along with a control patch color (it automatically generates a complementary control patch to maintain the overall gray average) and the layout of the control patches, and generates an image similar to the one shown in the figure below. Although we make sure that all 48 patches appear in every picture we take, my matlab scripts that analyze the image data consider only the middle 24 patches. This is to avoid errors and unreliable data due to image distortion along the edges.
Our first test pattern consists of a grid with four gray control patches placed at the corners of the actual sampled region. These four patches will remain unchanged throughout the experiment. Because the camera uses a center-weighted light metering system (as stated in the user's manual), we want to locate our control patches such that they have a minimal effect on the camera's color-balancing circuitry. Both the user-specified control patch and its complementary patch appear twice in the test pattern to improve experimental accuracy. As you can see in figure 1, we picked a light gray color for our control patch.
Figure 1: Gray world assumption experiment test pattern
In this case, we would not expect the camera to color-balance our test pattern because it fully satisfies the gray world assumption.
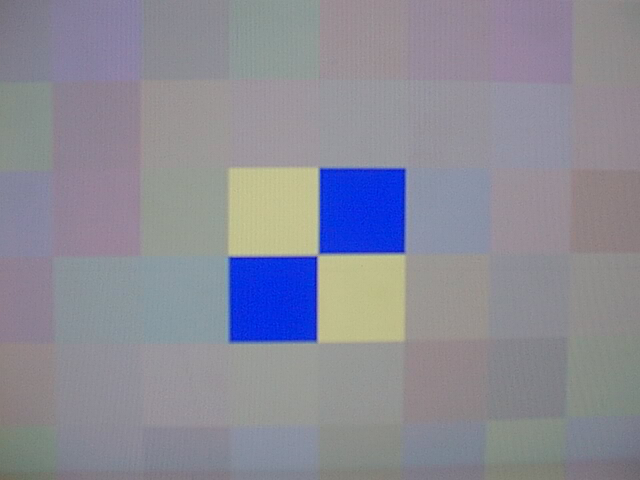
Our second test image is almost identical to the first, except that we multiply the red and green components of the 44 patches surrounding our four control patches by a factor of 1.3. This puts a yellow cast on the image, similar to the effect of tungsten lighting. If the camera attempts to correct this image according to the gray world assumption, it should scale the blue component of our four control patches such that it is 1.3 times higher that their red and green components.
Finally, for completeness, we generated a third test image where only the blue component of the surrounding patches is scaled by a factor of 1.3. This does not resemble the effect of any common illuminant at all, but if the camera merely applies the gray world assumption indiscriminately, we would expect the the red and green components of our control patches to be greater than the blue component by the same factor.
Here are the raw image data (bmp format) from this experiment:
And here are the same images (tiff format) after inverse gamma-correction:
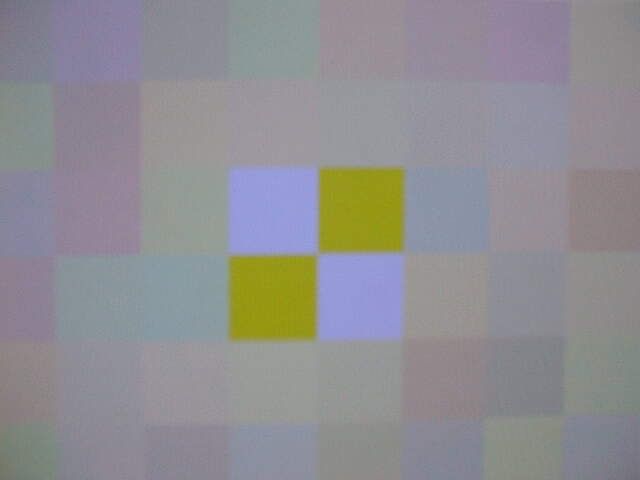
In our third experiment, we want to know if the camera uses bright spots, or specularities, in the image to determine the nature of the illuminant. Using the same code as before, we create a specular region on the test pattern by specifying a color of greater intensity than any of the other 44 colors in the grid as the control patch color. Now, because my code automatically generates a complementary patch to maintain an overall gray average, the gray world assumption holds for all of our test patterns. Furthermore, we place the control patches along with their complementary patches in the middle of the test pattern to ensure that the central region, which the light metering sensors give preference to, has a overall gray average as well. These measures prevent any form of color-balancing based on the gray world assumption, thereby allowing us to isolate the effects, if any, from applying the perfect reflector assumption.
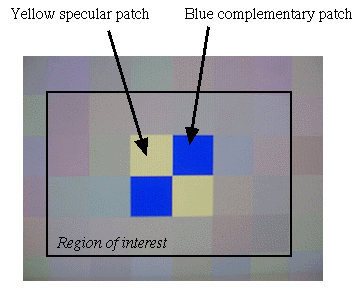
Figure 2: Perfect reflector assumption experiment test pattern
The first test pattern consisting of a gray specular patch is used as a control. The second test pattern (see figure 2) has a bright yellowish patch (250, 250, 120), whereas the third test pattern has bright bluish patch (120, 120, 250). The overall gray level in all three images in 120. If the camera does indeed rely on the perfect reflector assumption, we would expect it to scale the bright patches towards white, causing the average of the surrounding patches to deviate from gray in the process.
Here are the raw image data (bmp format) from this experiment:
And here are the same images (tiff format) after inverse gamma-correction: