Critical Flicker Fusion Distance
PSYCH 221 Final Project
By Sheila Bijoor (sbijoor) and Daniel Golden (dgolden1)
Introduction and Motivation
The human visual system interprets information from visible light in the
environment by periodically sampling images projected onto the retina. The
sampled information is then integrated by the visual system to form complex
decisions about whether an image is stable or moving. In some cases, however,
the periodicity in which the eye samples leads to limitations in its
responsiveness to change. When intermittent stimuli are presented, the visual
system's perception of whether the stimuli are separate, flickering, or "fused"
(i.e., multiple stimuli appearing as a single static stimulus) depends on
multiple factors. These factors include (1) luminance, or brightness, of the
stimuli (Hart Jr, WM 1987), (2) chromaticity, or color irrespective of
brightness, of the stimuli (Kelly 1974), (3) frequency at which the stimuli are
alternated (Truss 1955), (4) the retinal position of stimuli, or whether it
excites rods or cones (Tyler and Hamer 1990), (5) size of stimuli (Hecht and
Smith 1965), and others.
In this project, we investigate the effect of color contrast on the eye's
ability to identify flickering images. We wish to determine:
(1) the critical chromaticity and luminance distance between the a base and
alternate stimuli before which alternations between the base and alternate are
seen as fused. We call this distance the Critical Flicker Fusion Distance
(CFFD).
(2) how the CFFD depends on the particular subject characteristic of Red-Green
color-blindness.
We compare our results to previous work on this subject by Truss in 1955, in
which he measured the chromatic flicker fusion frequency (CFFF) as a function of
the chromaticity and luminance difference between pairs of colors presented
alternately.
Experiment Methodology
Equipment
To administer our experiment, we used the Psych Toolbox
(http://psychtoolbox.org), a set of third-party scripts for Matlab. The Psych
Toolbox uses specially compiled code in order to interface directly to the
computer's video card, while avoiding Matlab overhead. This allows for very
precise timing when performing vision-related psychophysical experiments.
However, because of the complexity required for this interface into the video
hardware, the Psych Toolbox is initially fairly difficult to install and work
with; we probably spent as much time attempting to install the bloody thing as
we did working with it.
Past experiments have shown that the refresh rate of typical LCD monitors (60-85
Hz) is often at or below the human threshold for flicker fusion. LCD monitors
typically have lower refresh rates than what modern video cards can support
because of their slow "response times," i.e., the time it takes for a pixel to
completely change from black to white and back again. Thus, we decided that LCD
monitors - despite their prevalence in our office, where the tests were
administered - would not be suitable for our test. Instead, we selected a
lonely, neglected CRT monitor (a KDS "VisualSensations" piece) that had been
sitting on the corner of Sheila's desk, collecting dust, since her matriculation
into our research group. Although the monitor was somewhat dim (indicating a
smaller-than-usual gamut), it did allow for refresh rates up to 120 Hz (not true
for many other CRTs that we tested). Therefore, this lonely pauper of a monitor
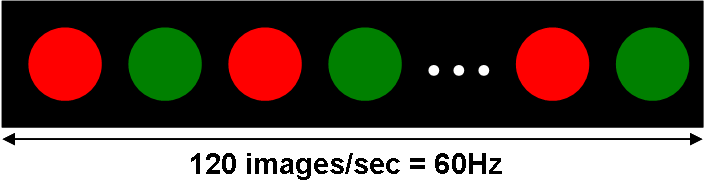
quickly became the prince of our psychophysical experiment. Note that a refresh
rate of 120 Hz allows for a maximum flicker frequency of 60 Hz (see below
image).
Initially, we intended for our experiment to traverse multiple flicker
frequencies and Base/End color pairs. However, during our initial testing
of the experiment, we determined that any flicker frequencies below 60 Hz (e.g.,
30, 20, 15 Hz) were too easy to perceive, and therefore not useful for our
experiment. Thus, our experiment was conducted using only the 60 Hz flicker
frequency.
We calibrated the VisualSensations monitor using a PR650 spectral photometer
measurement device and the Dmtoolbox Matlab code provided by the Stanford
Vision, Imaging Science and Technology Activities (VISTA) laboratory at
Stanford. The calibration procedure consisted of activating the monitor
phosphors in different linear combinations and measuring the resulting spectral
power distribution (SPD) of the display (below). This calibration data was
useful in our experiment to convert from absolute color spaces, such as CIE LAB
and XYZ to the proper values to input into the VisualSensations's RGB
framebuffer.
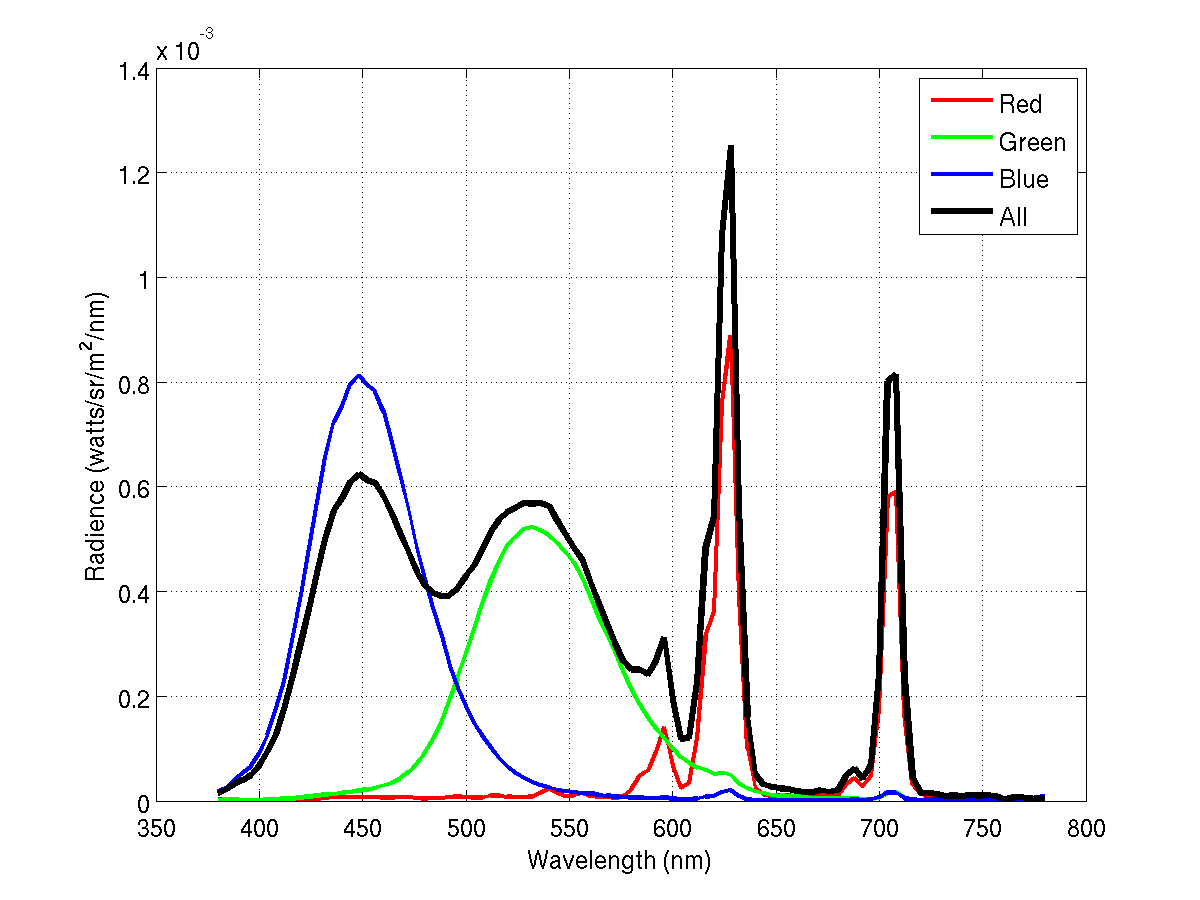 SPDs from calibration of KDS VisualSensations CRT monitor.
Experimental Procedure
Our experimental procedure was a follows. The user was shown two stimuli in
random order: (1) two collocated circles of color, flickering at 60 Hz, and (2)
the geometric mean in CIELAB space of those two colors (it was later pointed out
to us that the color that would better approximate the "mean" of the flickering
colors would have been the geometric mean in RGB space -- oops). The user was
then asked to select which of the two stimuli was the flickering one: either the
first, or the second.
We implemented a "staircase" procedure in our threshold detection. Beginning at
the "top" of the staircase (a Base/Alternate color pair for which the two colors
are distant from each other, for which flickering is easy to detect), the
subject may advance one step down on the staircase whenever they correctly
identify the flickering pair three times in a row. One step down on the
staircase corresponds to a Base/Alternate color pair that is closer together in
the CIELAB Euclidean norm sense (i.e., for which flickering is more difficult to
discern). If the user incorrectly identifies the flickering pair, they
immediately advance one step up on the staircase, bringing them to a
Base/Alternate color pair that is further apart in CIELAB space (i.e., for which
flickering is easier to discern). Every time the subject switches direction on
the staircase, this is known as a "reversal." The trial with any given Base/End
pair ends when either the subject has undergone four reversals, or has reached
the bottom of the staircase (which, in each case, corresponds to the eighth
Base/Alternate pair). The full experimental procedure is summarized below.
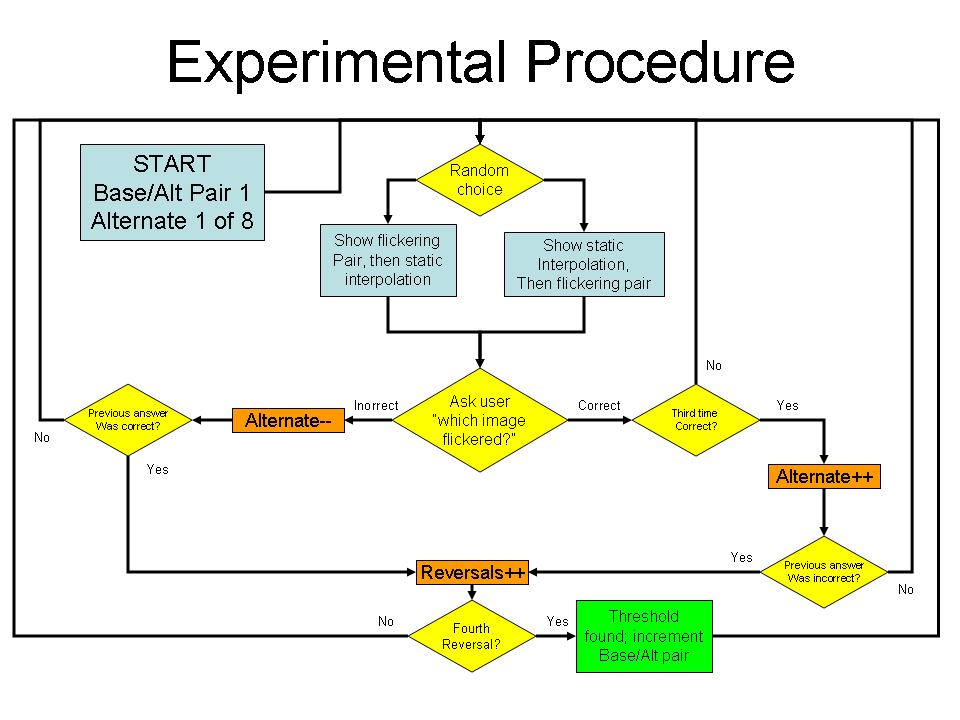 Flowchart for Experimental Staircase Procedure
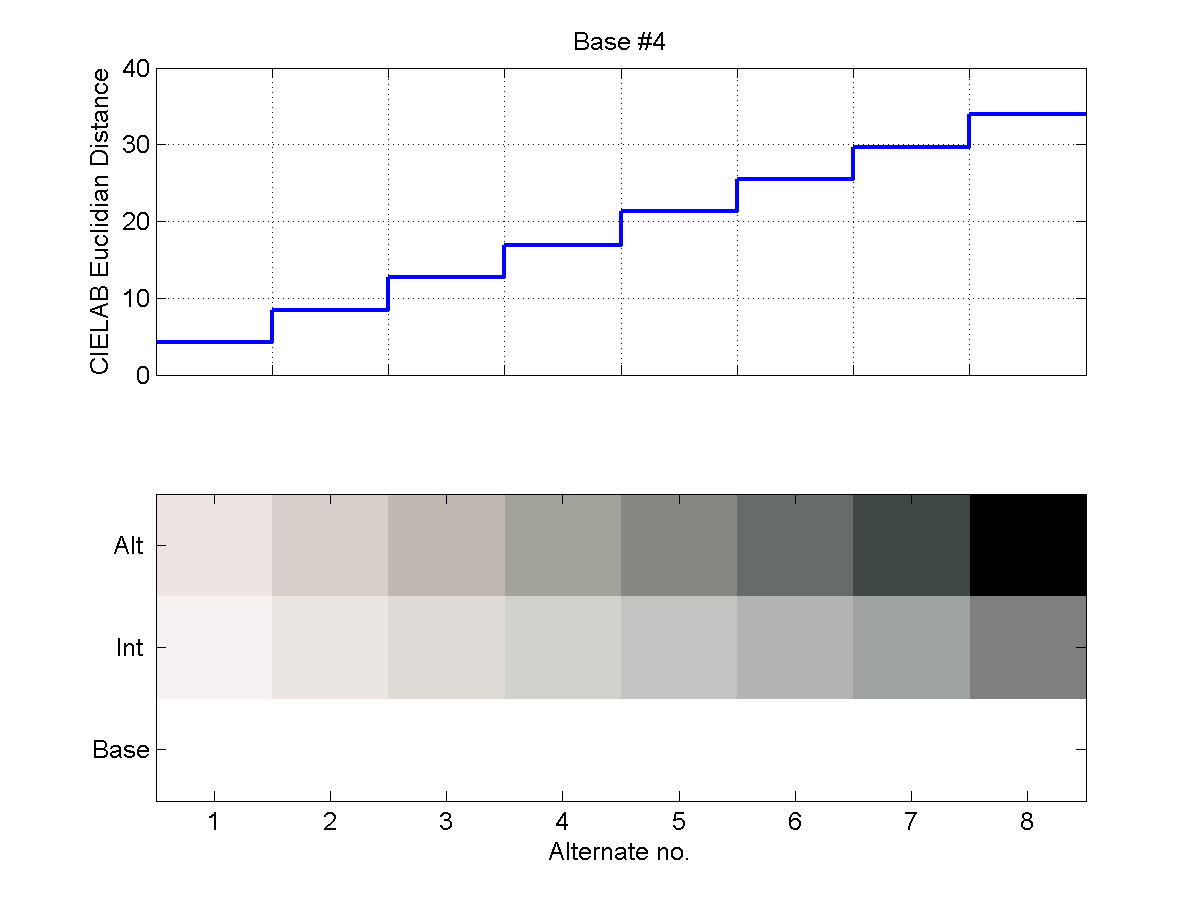
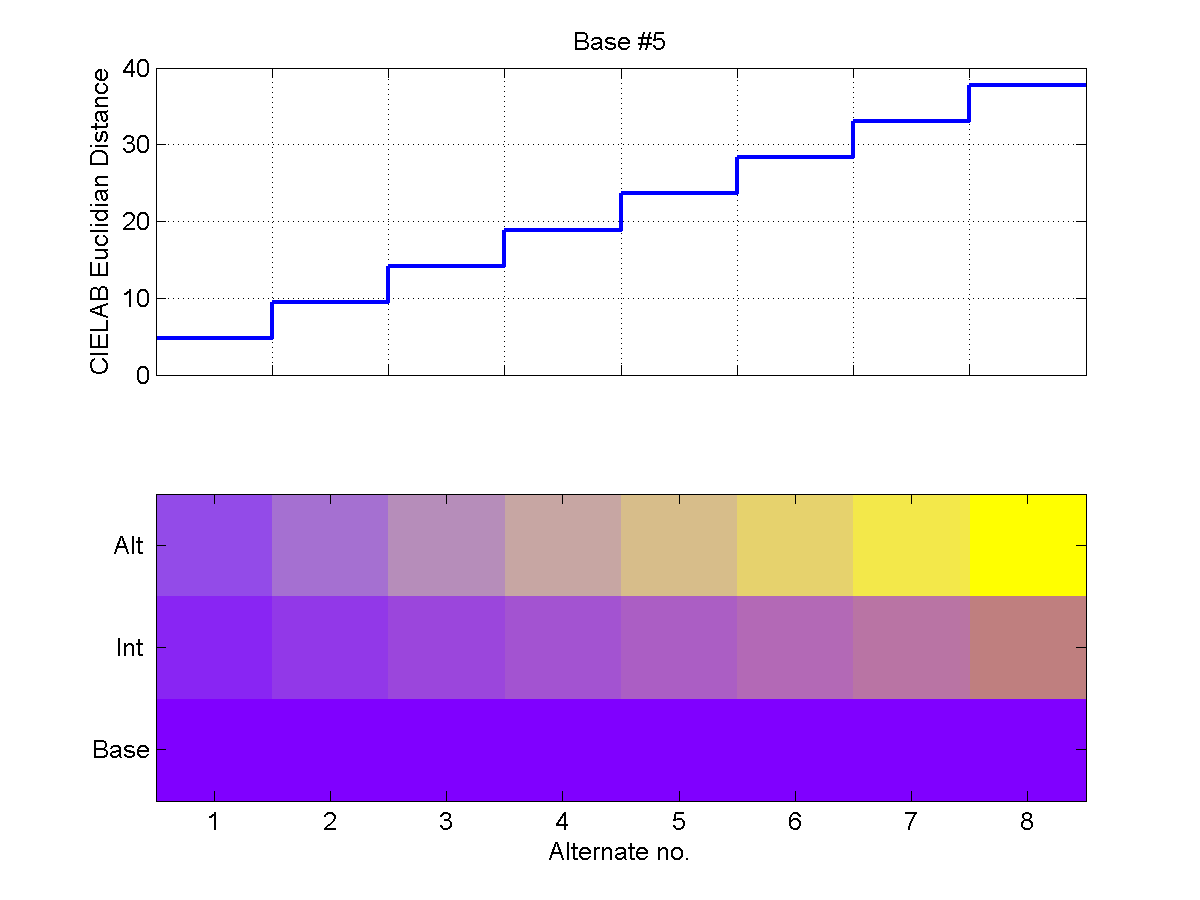
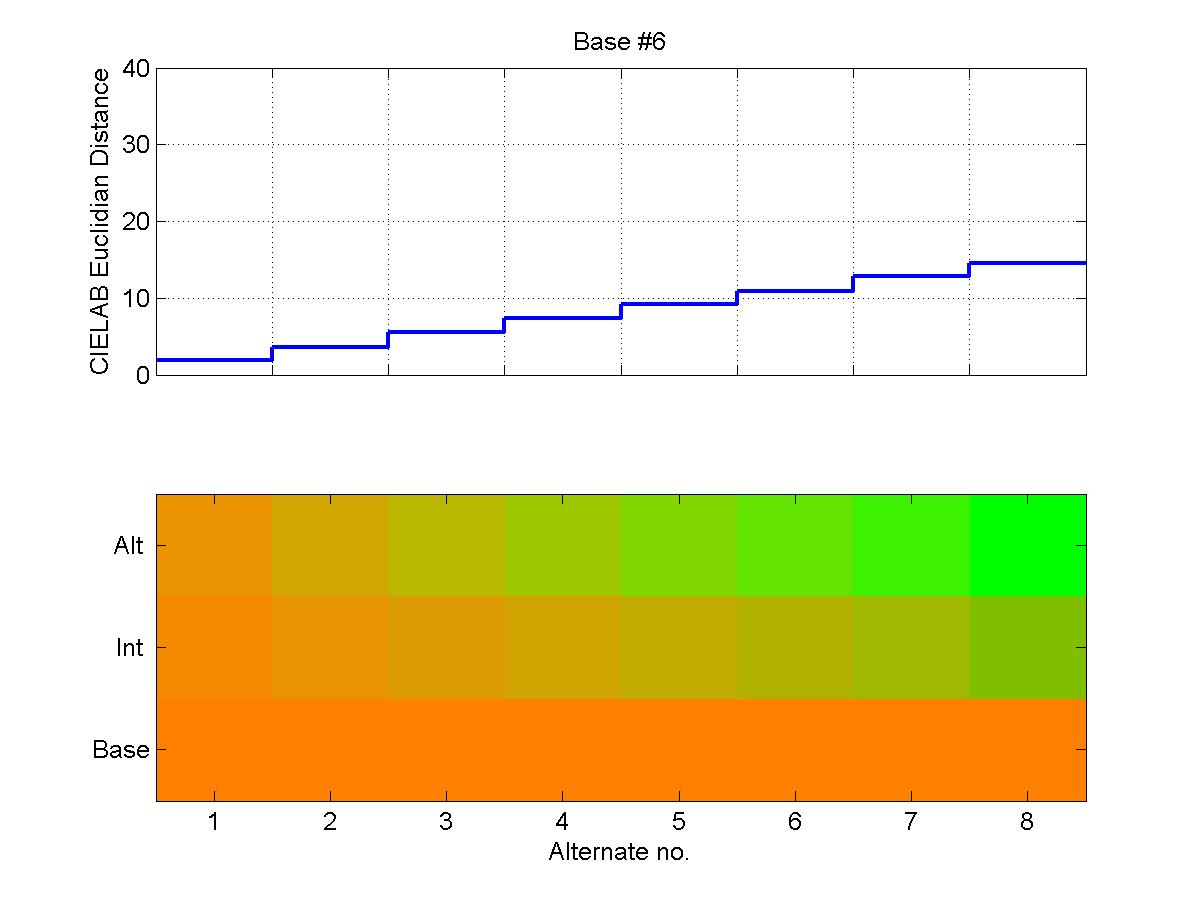
Color Choices
We chose six different Base/End color pairs for this experiment. A Base/End
color pair consists of the "Base" color and eight "Alternate" colors. The first
Alternate color is the "End" color, and there are seven linearly interpolated
colors (in CIELAB space) in between the Base and End colors. The staircase
begins by flickering the Base and End colors; each movement down the staircase
corresponds to flickering the same Base, and the next closer Alternate color to
the Base.
In addition to the three possible RGB Base/End color pairs, namely Red/Green,
Green/Blue and Red/Blue, we also used Black/White, Purple/Yellow and
Orange/Green. These Base/End pairs are summarized in the below table.
Base/End Pair
|
RGB Coordinates
|
Max CIELAB Euclidean Distance
|
Red/Green
|
[1 0 0]/[0 1 0]
|
25
|
Green/Blue
|
[0 1 0]/[0 0 1]
|
35
|
Red/Blue
|
[1 0 0]/[0 0 1]
|
20
|
White/Black
|
[1 1 1]/[0 0 0]
|
35
|
Purple/Yellow
|
[0.5 0 1]/[1 1 0]
|
40
|
Orange/Green
|
[1 0.5 0]/[0 1 0]
|
15
|
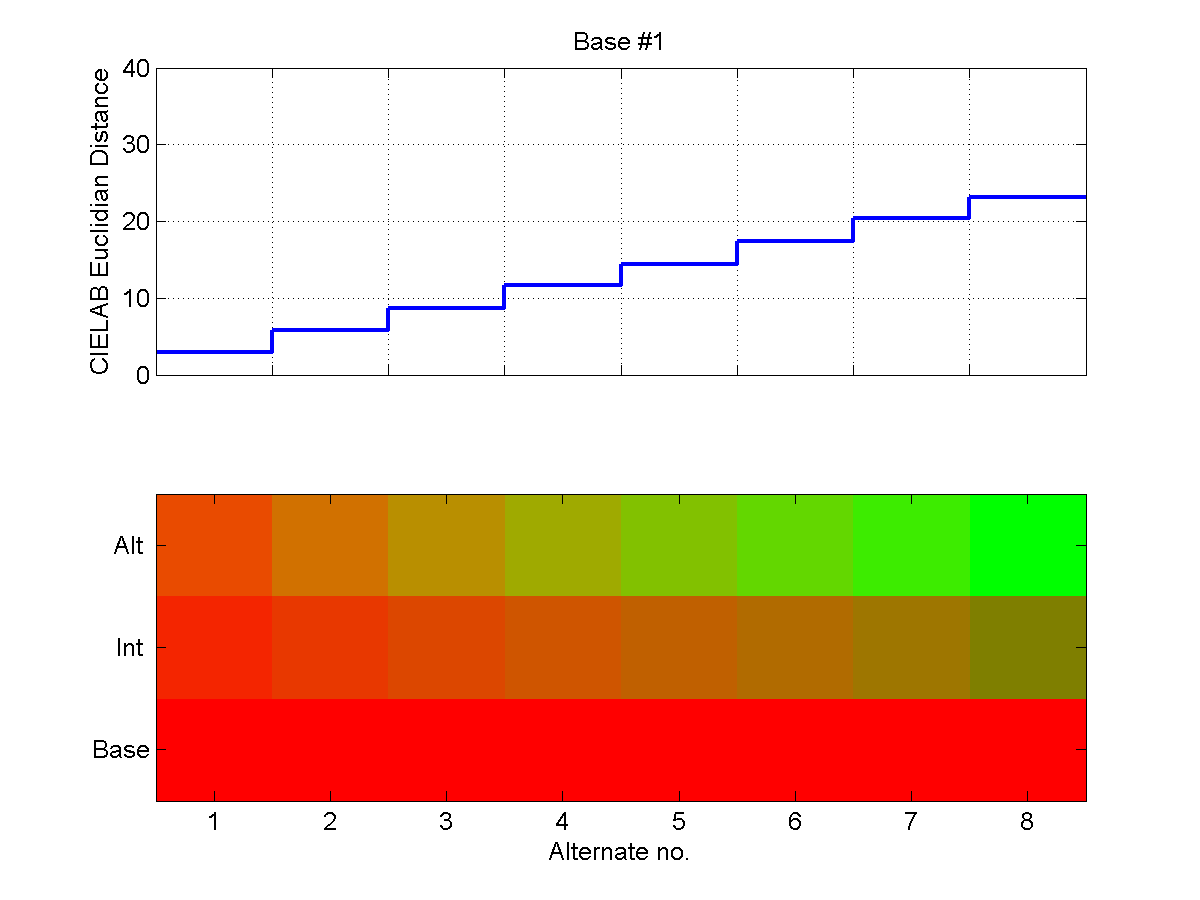
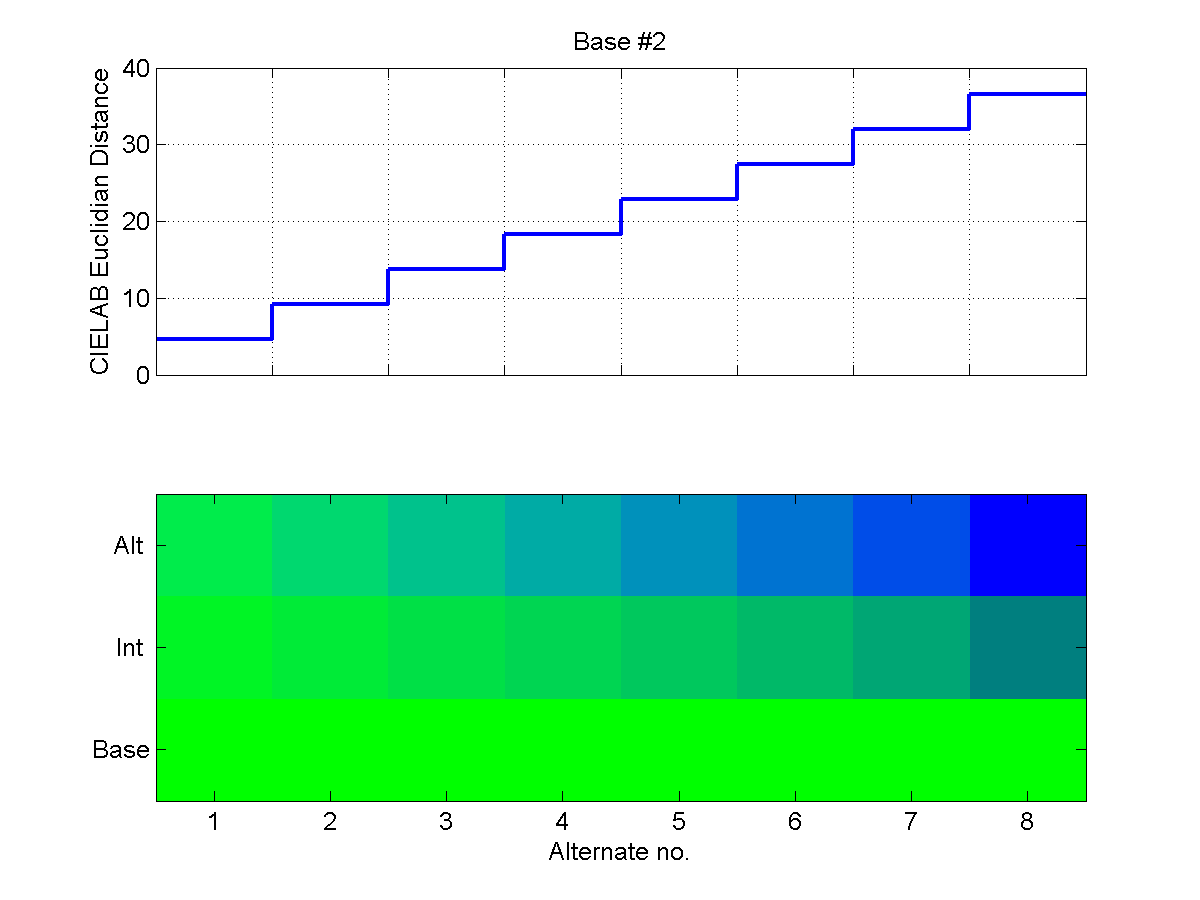
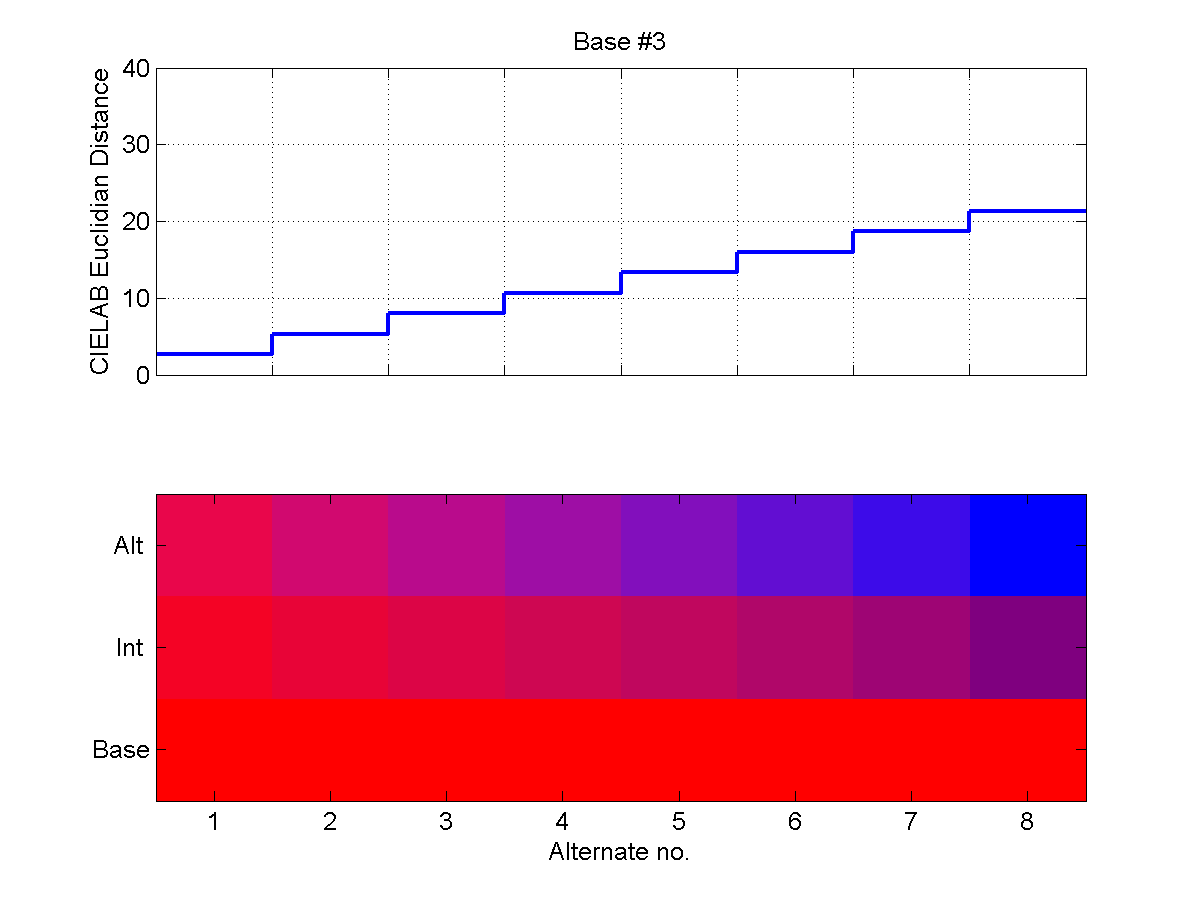
The following six two-part plots show the steps on the staircase for each
Base/End pair. In the upper portion of the plots, the CIELAB Euclidean distance
is shown for each Base/Alternate pair. In the lower portion of each plot, the
Alternate color is shown at the top, the Base color is shown at the bottom, and
the linear CIELAB interpolation is shown in the middle. Note that these plots
were generated with the same RGB values that were shown on our test monitor, but
because of differences in gamma and calibration, they will necessarily look
somewhat different on the medium on which you happen to be viewing them than
they did on our test monitor.
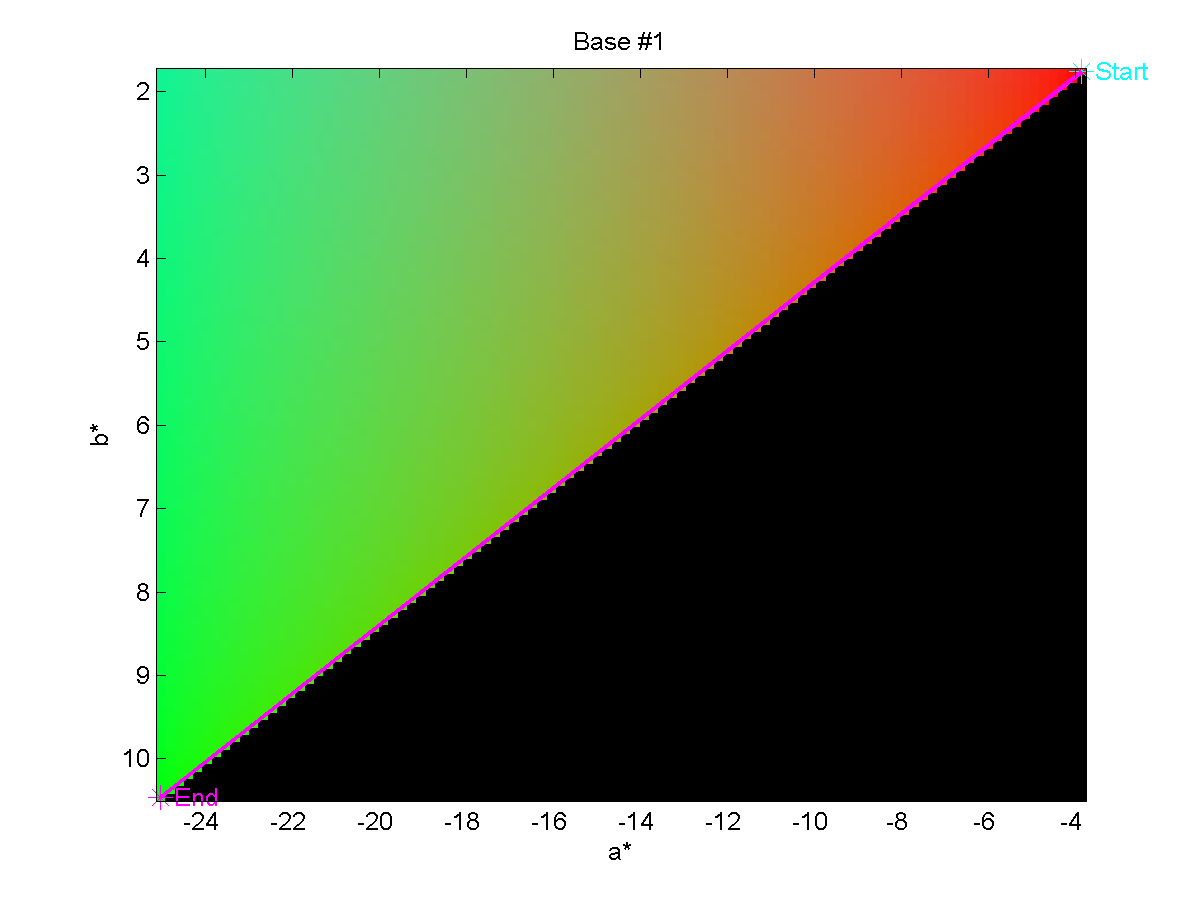
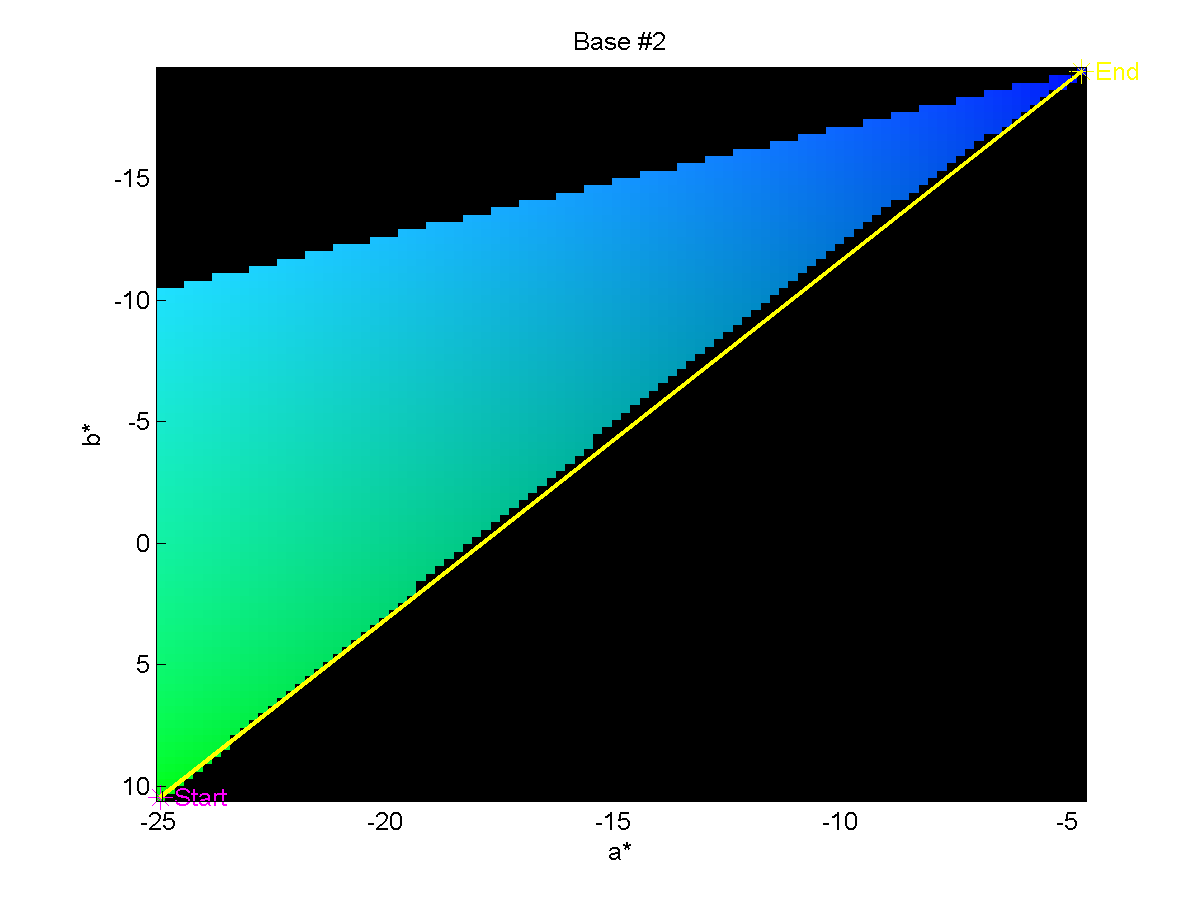
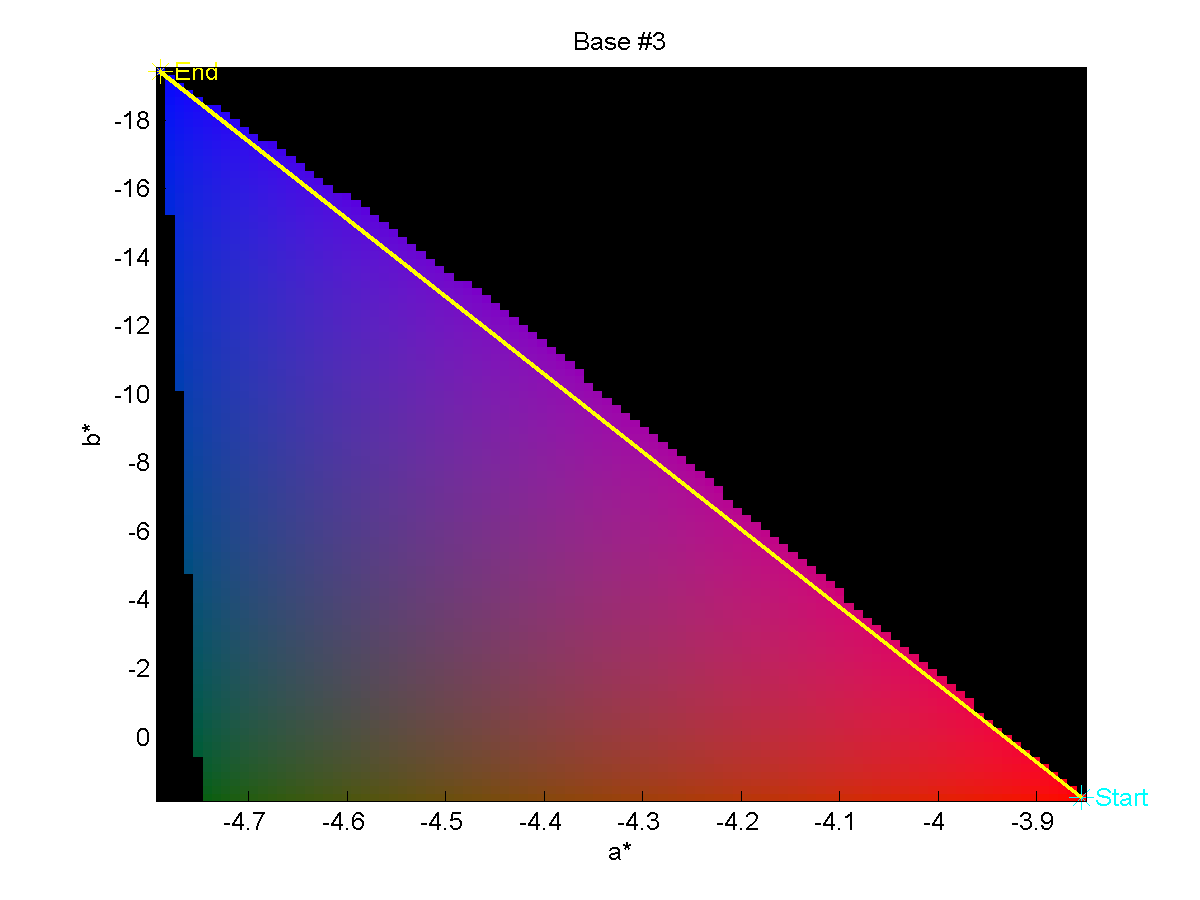
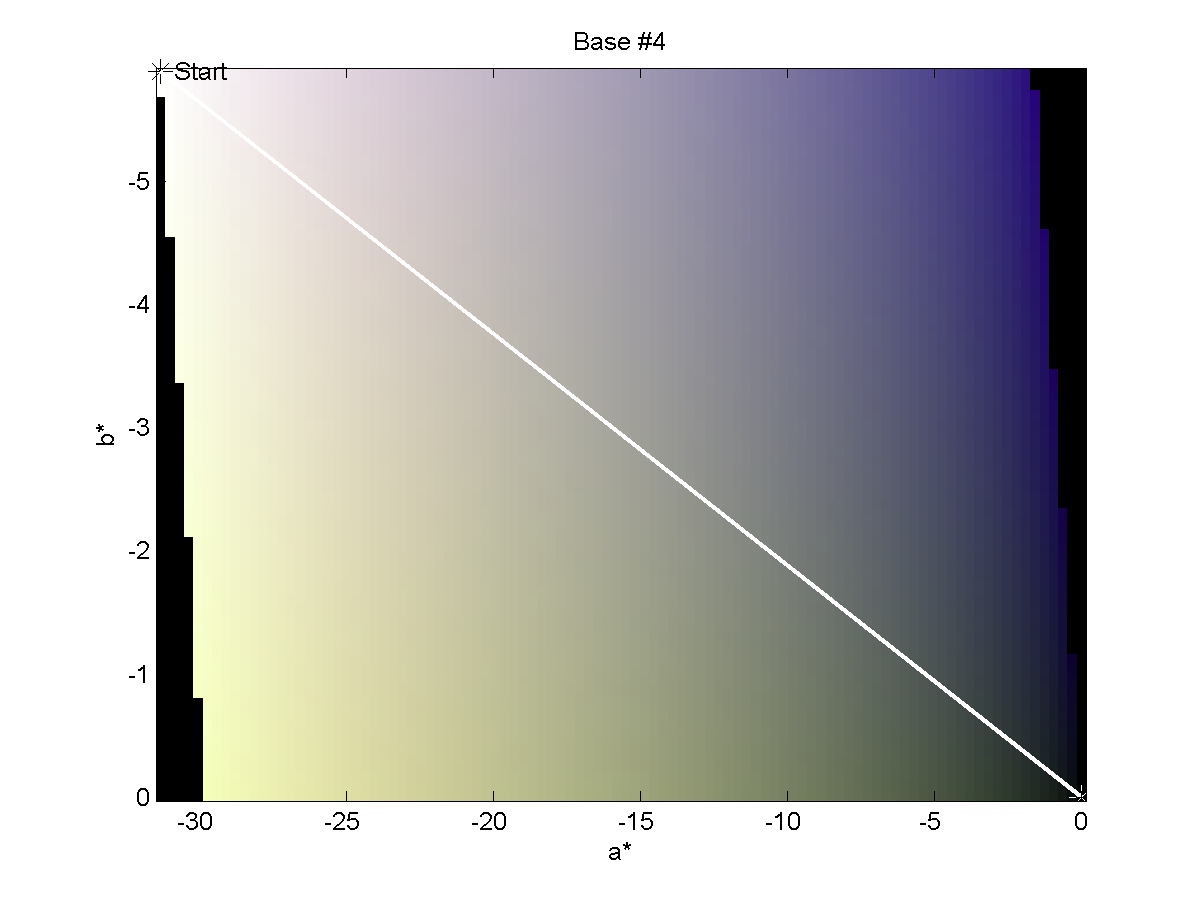
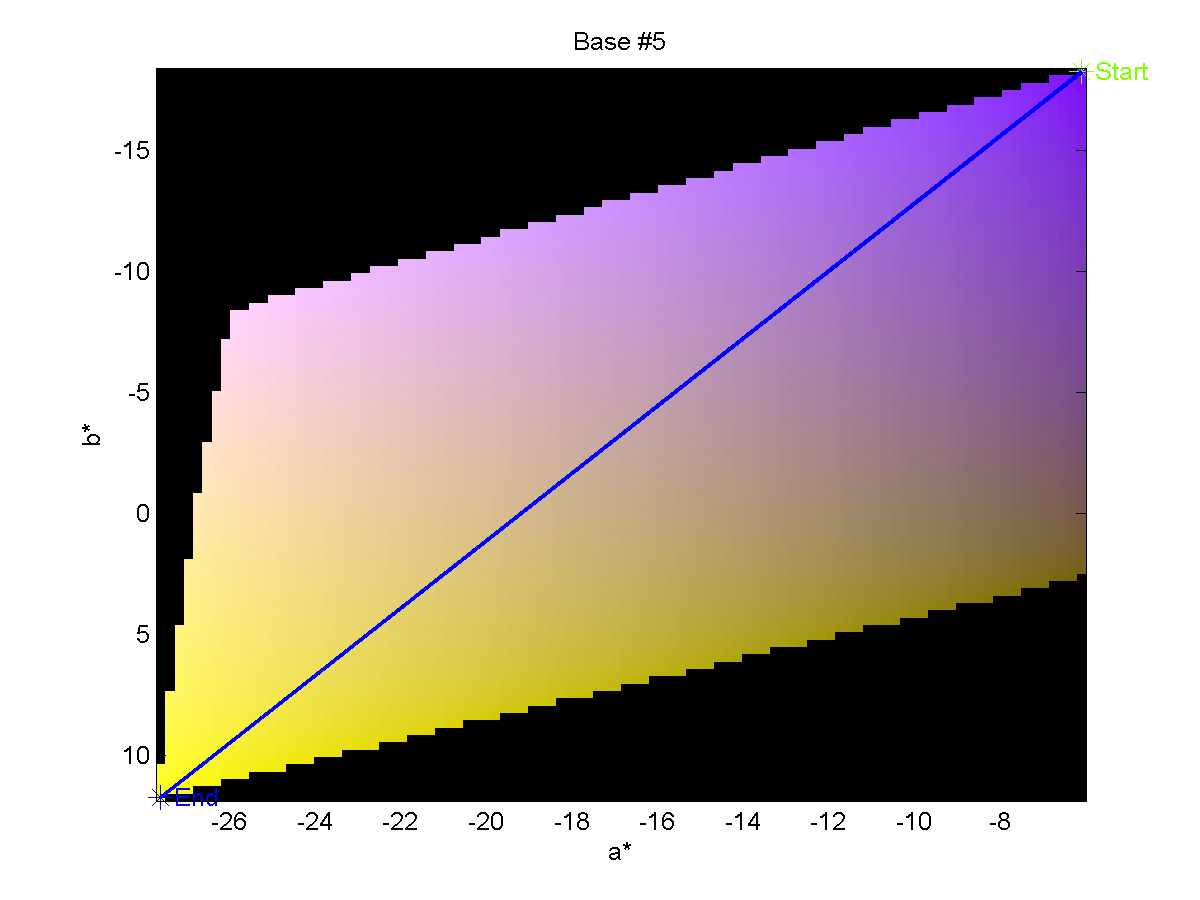
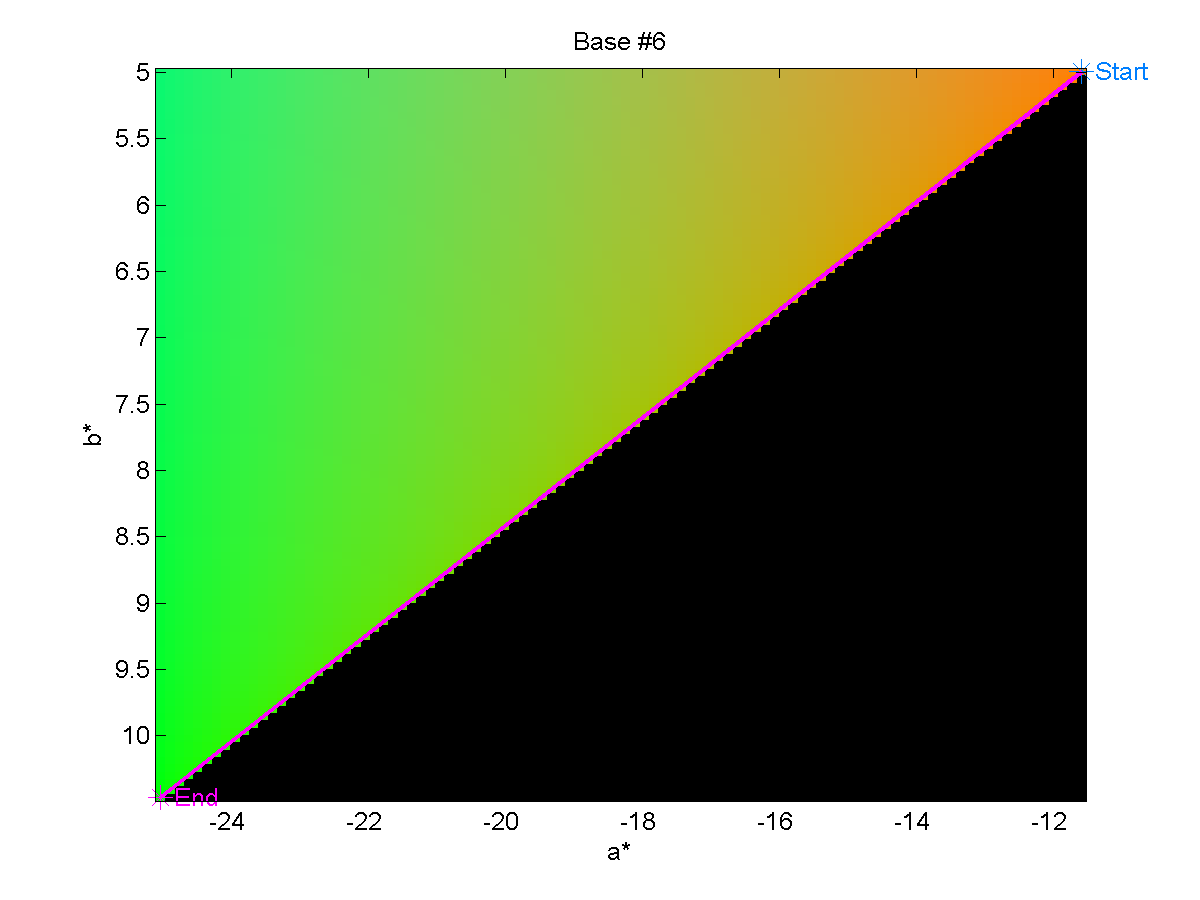
We may also show the paths from the Base to End colors on a planar cut through
the CIELAB color space to get a better feel of the space through which we are
traversing during the experiment. These images are shown below.
We can also simultaneously plot all of our trajectories through the RGB subset
of the CIELAB colorspace, as in the below plot. We can see that our experiment
samples a good portion of the RGB space.
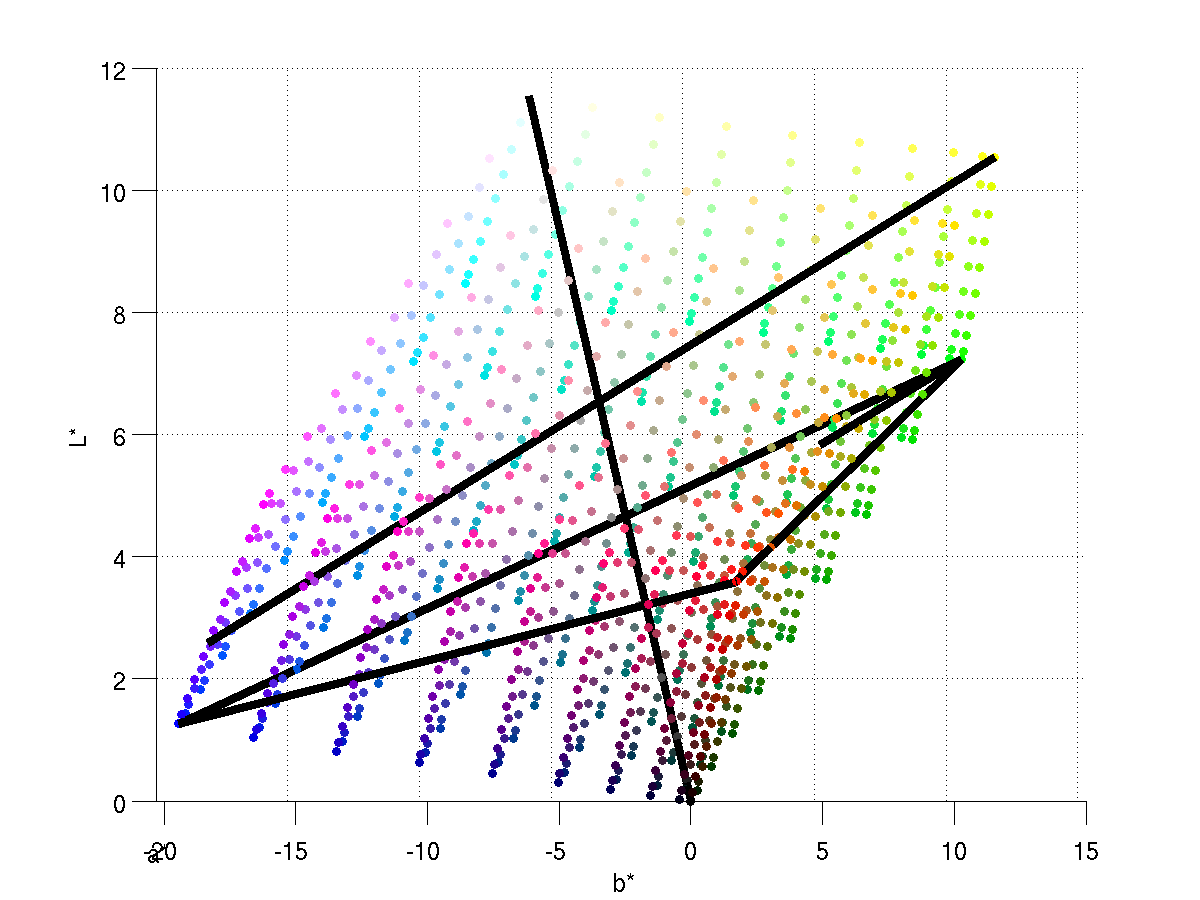 Experiment Trajectories through RGB subspace of CIELAB space. The image is
projected onto the a* plane.
Experiment Trajectories through RGB subspace of CIELAB space. The image is
projected onto the a* plane.
Subject Information
Seven male graduate students at Stanford University served as subjects for this
experiment. Six subjects reported that their color vision was normal and one
subject reported Red-Green color-blindness. One subject, who is also one of the
experimenters, had previously undergone extensive self-administered flicker
photometry testing. Each was given a preliminary training session and was aware
of the test objectives.
Results
The results of the experiment were analyzed using Matlab. The code is included
in Appendix B.
Staircase Plots
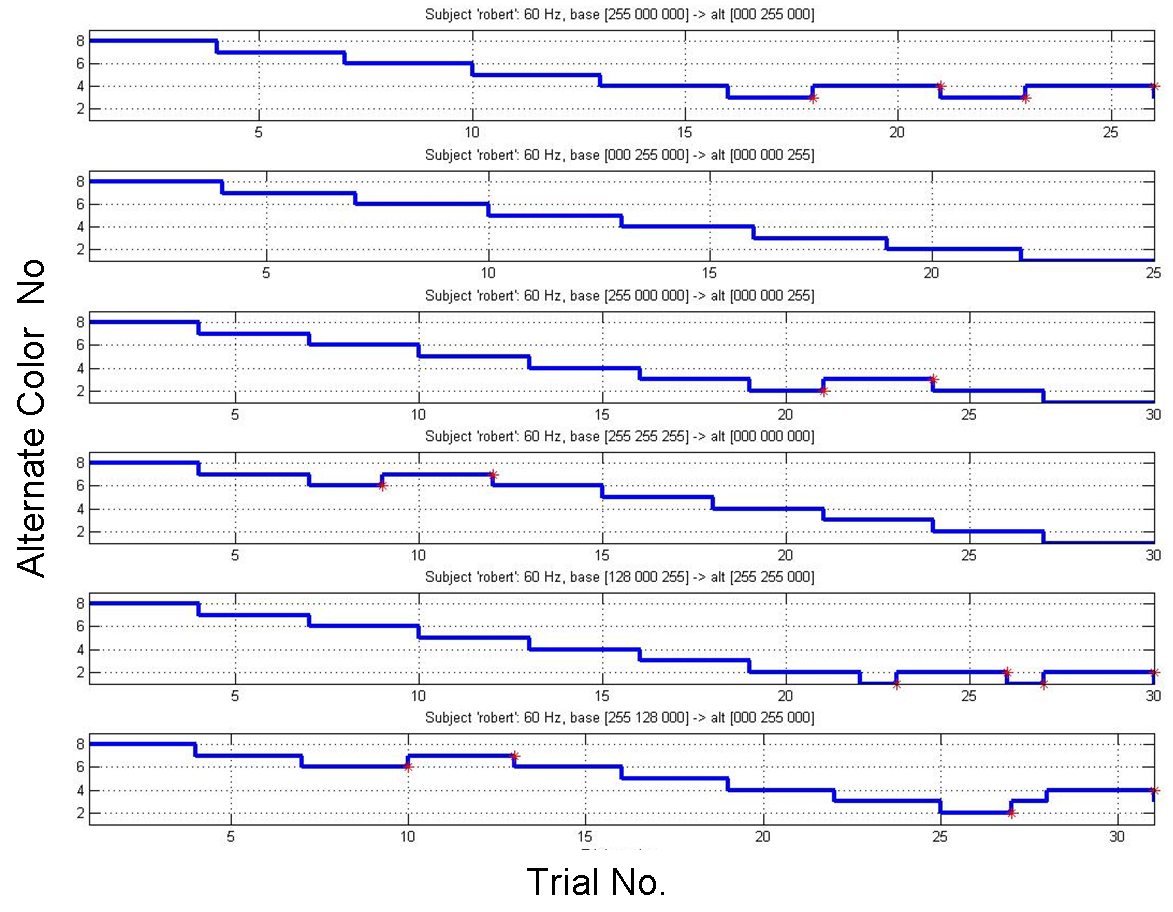
To determine the CFFDs, a staircase plot was produced for each subject. The
below figure, for example, shows a typical staircase plot. Each subplot
represents the subject's responsiveness to flickering along a single Base/End
pair axis. A descent in the staircase indicates that the subject accurately
identified flickering three consecutive times and was then shown the base and
a closer alternate. An ascent in the staircase indicates that the subject
could not accurately identify flickering and was again shown the previous base
and alternate. The red markers on the staircase plot indicate reversals, which
occur when the subject ascends or descends the staircase to a base and
alternate pair that he/she saw in the previous step.
Staircase plot for Subject "RN."
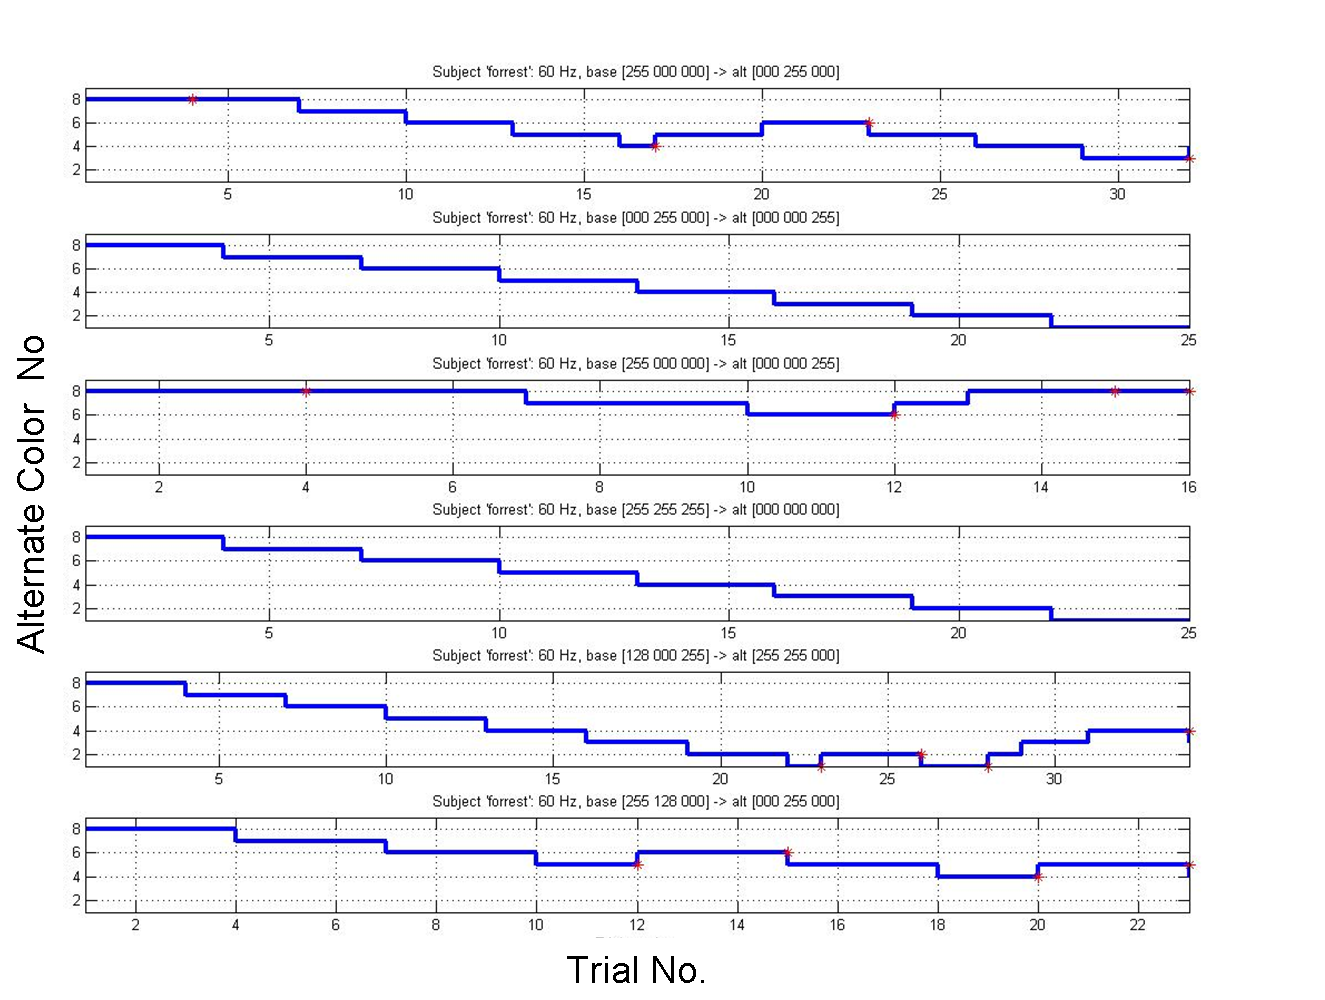
The staircase was designed to give a threshold resolution equivalent to
the height of a single step on the staircase. This is because it was assumed
that subjects would accrue most reversals between two adjacent steps on the
staircase (i.e., oscillate enough times between two adjacent alternates to
make it obvious that the threshold lay in between those steps). The results of
the experiments, however, showed that many subjects descended the staircase,
then ascended again by multiple steps. In the below figure, for example, the
uppermost subplot shows that the subject oscillated between steps 4, 5, and 6
for seven steps, then ended the test by descending to step 4. The average
threshold for these oscillations does not reflect a resolution of a single
step and inherits a large degree of uncertainty.
Staircase Plot for Subject "FF."
CFFD Calculations
The CFFD represents the Euclidean distance between the Base color and the
alternate color at the threshold. To determine this value for Base/End pair and
from each subject, the threshold step level was first calculated in each
staircase subplot. This was done by averaging the staircase levels during at
which the four reversals took place. In instances where there were less than
four reversals, such as when the user successfully descended the staircase to
the last step, the threshold was determined to be the last step. The CFFD was
calculated as the Euclidean distance between the base and threshold alternate
pair in LAB coordinates:
CFFD = sqrt[ (Lbase -
Lalt)2 +
(abase -
aalt)2 +
(bbase -
balt)2]
where Lbase, abase, and bbase are the LAB
coordinates of the base color and Lalt, aalt, and
balt are the LAB coordinates of the alternate color at the threshold.
The CFFDs for each subject and Base/End pair is shown in the below figure. The
results show that all subjects were able to descend the staircase entirely for
Base/End Pair 4 (White/Black pair), achieving a CFFD of under 10 units. For
base/end pairs 1, 2, and 6 (Red/Blue, Green/Blue, and Orange/Green), the
subjects all achieved thresholds that were less than 10 units apart from each
other, corresponding to two steps on the staircase. One outlier in the results
was the Subject "DG" (results marked in light blue). This subject obtained a
threshold that was significantly higher than the average for base/end pairs
2,3, and 5. Though we will not make specific conclusions about this subject's
results, it is worthy to note that the subject (1) complained of eye dryness
due to wearing contact lenses, and (2) has taken the test at least ten
consecutive times before so his eyes might have been tired (3) was
particularly ornery due to point (2).
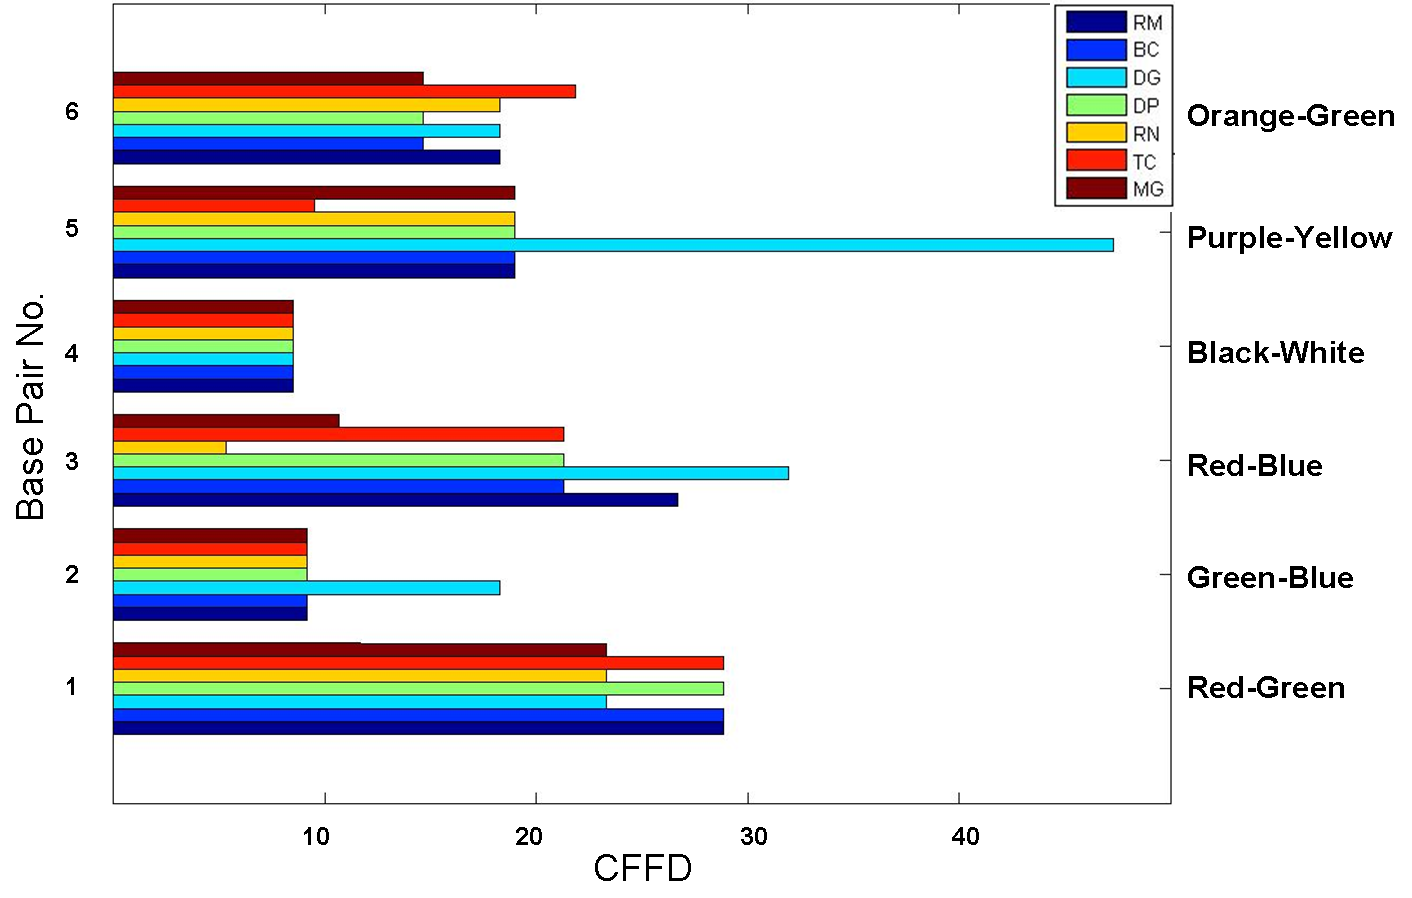
Critical flicker fusion distance (CFFD) for six base/end pairs from seven
subjects
Subject "TC" (results marked in bright red) was known to have red/green
color-blindness. Prior to the experiment, the subject reported difficulty in
differentiating red and green colors , but did not have specific information
about the degree of his color-blindness or his ability to differentiate
between differing levels of luminance. Interestingly, subject TC achieved the
same, if not lower, threshold than other subjects in all base/end pair tests,
except in the Orange/Green pair (in which his CFFD was higher by less than 5
units). This subject also performed the best in the Purple/Yellow pair test,
achieving a CFFD at least 10 units lower than all other subjects.
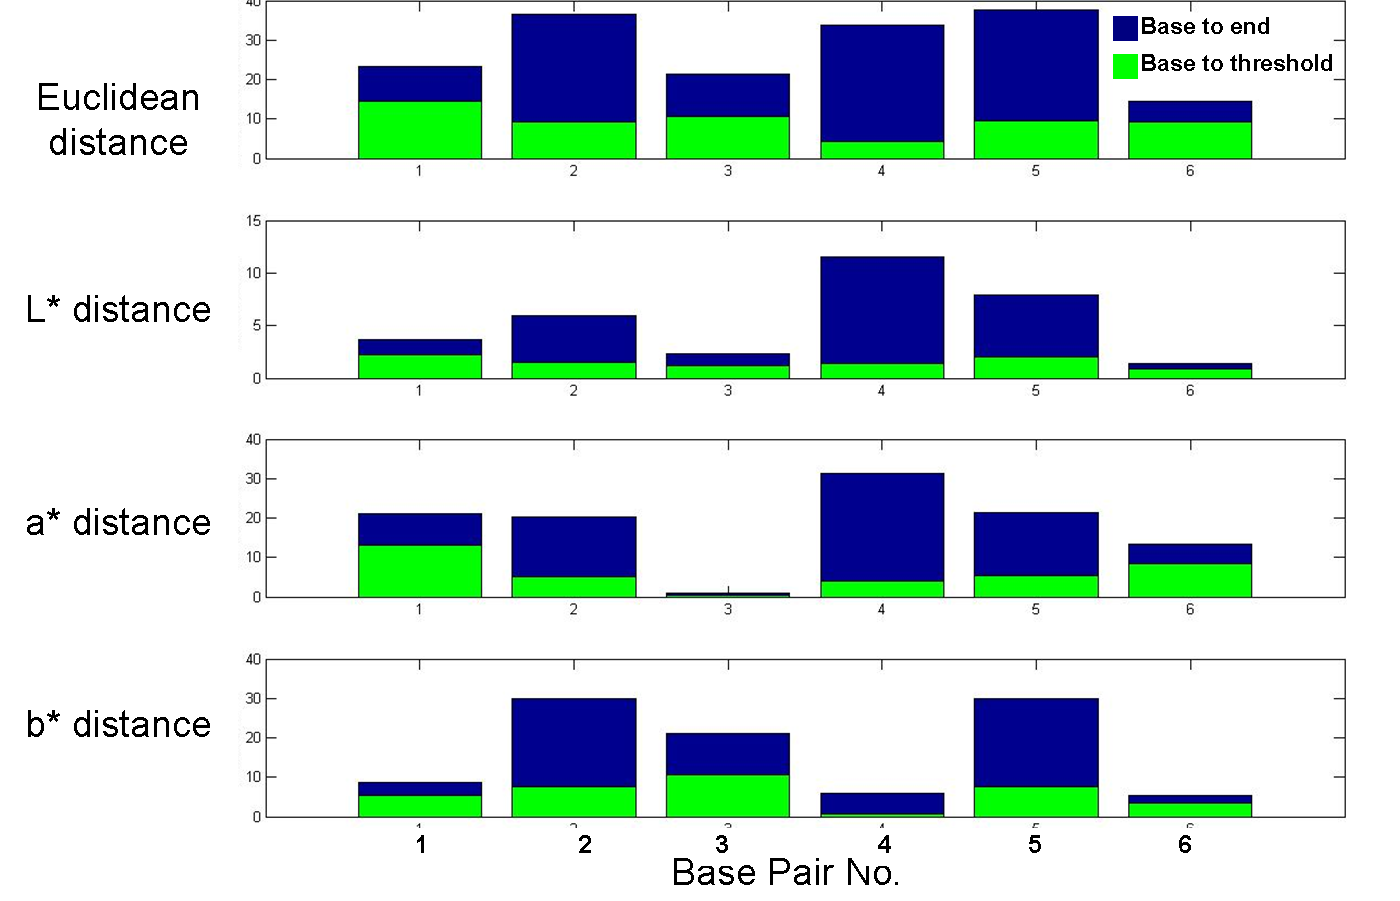
LAB Distances
The below figure shows the differences in LAB coordinates for each base/end pair
in blue. The top subplot shows the Euclidean distance between the pairs, and the
lower three subplots show the L*, a*, and b* distances between the pairs. The
minimum Euclidean distance is between the orange and green pair, and the maximum
Euclidean distance is between the purple and yellow pair. The green bars,
superimposed on the blue bars, show the Euclidean, L*, a*, and b* distances
between the base and threshold colors (averaged over all subjects) for each
base/end pair. It is interesting to note that the Euclidean distance between the
base and threshold varies in the small range from 5-15 units. In fact, the L*
distance between the base and thresholds vary in the even smaller range between
1-2.5 units. The a* and b* distances are not confined to such narrow ranges.
These results suggest that the contrast in luminance (L*) plays the
largest role in determining a subject's ability to identify flickering,
regardless of where the base and alternate colors exist in the color space.
Indeed these results would also explain why the red/green color-blind subject
performed normally compared to other subjects if we assume that he does not have
trouble differentiating levels of luminance.
L*, a*, and b* distances between base and end colors, and base and
threshold colors
Comparison of Results to Previous Work
The results of this experiment agree with previous work in this field. The
Ferry-Porter Law, for example, states that the critical fusion
frequency (CFF) is proportional to the logarithm of the
luminance (L) of the flickering stimulus
and can be expressed as
CFF = K logL + C
where K and C are constants (De Lange 1958). This law
suggests that flicker fusion perception is most heavily related to luminance
(L*), and not as heavily related to chromatic composition (a* and b*). Indeed
other studies have shown that under photoptic conditions (in which cones are
excited, as opposed to rods), the CFF for lights of different
wavelengths with equal brightness also conform to the Ferry-Porter Law and
follow the logarithmic function as brightness increases. However, under scotopic
levels (when the rods are functioning), the CFF fans out for different
wavelengths.
In this experiment, we can assume that we are operating in photoptic conditions
since the monitor screen provides adequate brightness and color variations to
excite the cones. Thus the results agree with the previous work, showing that
contrast in luminance is the greatest factor in identifying flicker, regardless
of color.
Conclusions
In this experiment, the critical flicker fusion distance was measured for six
pairs of base/end color pairs that spanned the RGB space using 8 subjects. The
results showed that the difference in luminance between the base and alternate
color matter significantly more than (1) the distance between the base a* and
alternate a*, (2) the distance between the base b* and b*, and (3) location of
base color in the color space, and (4) direction in color space along which the
alternate is chosen.
The results also suggest that Red/Green color-blind individuals will have
equivalent ability to identify flickering, assuming that their ability to detect
contrast in luminance is not impaired.
Acknowledgments
We wish to thank several members of the Stanford Vision Science and Neuroimaging
Group, in particular Bob Dougherty, Joyce Farrell, Kaoru Amano, Serge Dumoulin,
and Brian Wandell.
Authors

(Subject SB, who inexplicably developed an ear infection immediately after the
experiment)
(Subject DG, whose orneriness during experimentation was later
found to be a preexisting condition)
References
De Lange DZN H (1958) Research into the Dynamic Nature of the
Human Fovea® Cortex Systems with Intermittent and
Modulated Light. II. Phase Shift in Brightness and Delay in Color Perception.
J Opt Soc Am 48: 784-789.
Hart Jr, WM (1987) The temporal responsiveness of vision. In:
Moses, R. A. and Hart, W. M. (ed) Adlers Physiology of the eye, Clinical
Application. St. Louis: The C. V. Mosby Company.
Kelly DH (1974) Spatio-temporal frequency characteristics of
color-vision mechanisms. J Opt Soc Amer 64: 983-990.
Truss (1955) Chromatic Flicker Fusion Frequency as a Function of
Chromaticity Difference. Journal of the Optical Society of America 47:12:
1130-1134.
Tyler CW and Hamer RD (1990) Analysis of visual modulation
sensitivity. IV. Validity of the Ferry-Porter law. J Opt Soc Amer A
7:743-759.
Appendix 1: Source Code
Source Code for the experiment can be accessed at
http://www.stanford.edu/~dgolden1/sbijoor_dgolden_psych221_final_proj.tar.gz
Appendix 2: Work Breakdown
The work for this project was shared equally by Dan and Sheila, and included:
-
Designing experiment
-
Conducting literature review
-
Writing code for stimuli and staircase method
-
Arranging experimental set-up
-
Calibrating monitor
-
Conducting experiments
-
Analyzing results
-
Presentation
-
Report