Channel – Rhodopsin
Based Vision Prosthesis Model
Elena Kaye
Maryam Etezadi – Amoli
Sharareh Noorbaloochi
Khuram Zia
Psychology 221
Winter, 2007

Introduction
Motivation
Many diseases, such as retinitis
pigmentosa and age-related macular degeneration, cause blindness by damaging
the photoreceptors, but leave the retinal ganglion cells unharmed. Retinitis pigmentosa involves the
degeneration of photoreceptors and affects 70,000 people in the
Current retinal prostheses can be divided into two categories: epiretinal and subretinal.
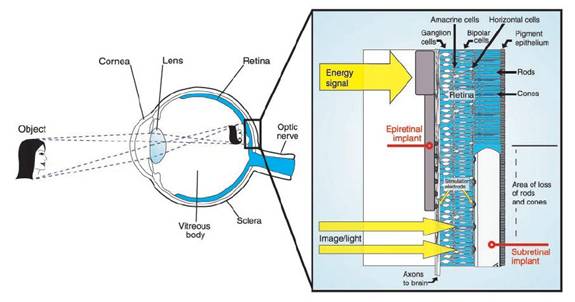
Figure 1: Epiretinal and
subretinal implants (from Zrenner, 2002)
Subretinal devices consist of light-sensitive micro-photodiodes that are implanted between the pigment epithelium layer and the outer layer of the retina where the photoreceptors are normally located. These devices replace the rods and cones with photodiodes. Light falling on the photodiodes activates the attached electrodes, which then activate the remaining retinal cells. An advantage of subretinal implants is that by replacing only the damaged photoreceptors, the rest of the retinal pathway and natural neural network of the eye is preserved, thus maintaining proper spatial encoding [11].
Epiretinal devices are implanted on the top layer of the retina, where the retinal ganglion cells are located. These devices receive electrical signals from a distant camera and processing unit and directly stimulate the ganglion cells that form the optic nerve. Epiretinal devices bypass the processing network of the retina completely, and thus the camera and processing system must do the proper image encoding so that the signal transmitted to the optic nerve will be properly decoded by the visual cortex [11].
The purpose of this project is to investigate a totally different type of retinal prosthesis based on channelrhodopsin.
Rhodopsin
Channelrhodopsin-2 (ChR2) is a photopigment that can be embedded in the membranes of specific neurons using viral delivery. ChR2 induces light-gated channels, so once the pigment is in place, light pulses can be used to activate these channels, triggering the neurons to fire on a millisecond-timescale [2]. Bi et al. took this further by embedding rhodopsin in the membranes of retinal ganglion cells of mice. By shining light on the cells, they were able to induce the cells to fire and transmit a signal to the visual cortex. Thus ChR2 introduces a new paradigm in visual prostheses, where surviving retinal ganglion cells serve as the replacement for damaged photoreceptors [1].
Theoretically, with the proper sequence of light pulses, ganglion cells can be triggered to mimic their natural firing patterns, thus inducing vision. The purpose of this project is to investigate the different aspects and challenges involved in using ChR2 as a visual prosthesis.
Receptive Fields
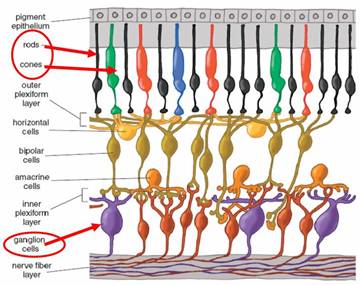
The pathway in the retina from the rods and cones to the ganglion cells involves complex processing from many different cell types. Since the ChR2 prosthesis method involves bypassing this processing system and directly stimulating the ganglion cells (similar to epiretinal devices), we must first understand the nature of this processing so that we can hope to accurately mimic it. Figure 2 from [8] shows the many layers involved in processing the rod and cone outputs.
Figure 2. Multilayer cell.
This complexity can be modeled using the concept of a receptive field. The receptive field of a ganglion cell is the region in the retina where light influences the response of that ganglion cell. There are several different types of receptive field architectures, but in this project, we will consider only the center-surround architecture. There are two classes of center-surround receptive fields: on-center, off surround, and off-center, on-surround. Cells modeled by an on-center receptive field respond by increasing their firing rate above the baseline spontaneous firing rate when light falls on the center of their receptive field. Light falling on the surround area of the field causes a decrease from the baseline spontaneous firing rate. Off-center cells respond in the opposite way: light falling on the center decreases the firing rate from baseline, and light falling on the surround increases the rate. [10]
A common way to model the center-on receptive field is by using a function created from the difference of two Gaussians:
![]()
where σcen is the standard deviation of the Gaussian representing the receptive field center and σsur is the standard deviation of the Gaussian representing the surround.
Figure 3 shows the creation of an on-center receptive field using this model.
Figure 3. Difference of Gaussians model.
With the receptive field concept, we can model the ganglion cell response using a linear relationship. The change in firing rate from baseline (Δr) can be found using the following relation:
![]()
where G(x,y) represents the receptive field and I(x,y) represents the stimulus (image) intensity at position (x,y). Thus finding the response of a ganglion cell (the change in firing rate from baseline) to a contrast pattern involves taking a weighted sum of the intensity values, where the weighting is determined by the receptive field of the ganglion cell.
Methods
Block diagram of overall
system
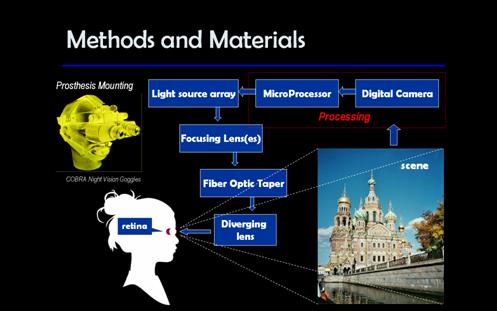
Block Diagram of the
Processing Steps
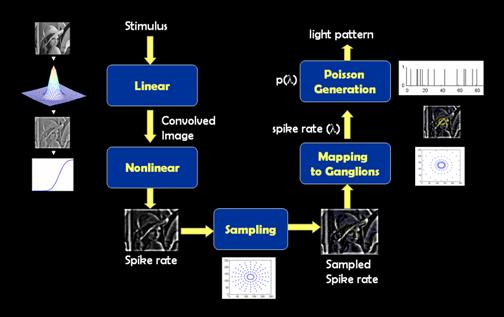
Figure 4. Block
diagram of the processing algorit
Description of components in processing scheme
Stimulus
The stimulus for our system is a still input image of size 256 x 256 pixels. We are assuming that the entire input image spans 5 degrees of visual angle, centered on the fovea. Using the conversion factor of 1 degree = 300 um, each pixel in image space corresponds to 0.0195 degrees of visual angle or 5.86 um on the retina.
Linear
The linear portion of our system involves determining the change in spike rate for the ganglion cells due to the input image. As previously described, this involves doing an element-wise multiplication of the receptive field with patches of the image. With a circularly-symmetric receptive field, as we are using, this operation is equivalent to convolving the input image with the receptive field function. Since convolution is easily implemented in Matlab using the conv2 command, viewing this calculation as convolution greatly simplifies this step of the procedure. We used the ‘same’ flag for the conv2 operation so that our resulting image would not change in size, but this choice means that the edges of the resulting image contain some artifacts that do not directly correspond to the desired operation of pointwise-multiplication of the receptive field with individual patches of the image.
Since receptive fields increase in size with distance from the fovea, we convolved the input image with Gaussians of many different sigma values so that pairs of images could later be chosen according to the desired size of the receptive field center and surround. Figure 5 shows the result of convolving the input image with Gaussians representing the center and surround responses, then taking the difference of the resulting images. The intensity of each pixel in the difference image indicates the change in spike rate for the ganglion cell whose receptive field is centered at that pixel.
Nonlinear
In order to get a reasonable spike rate value, we must perform one more processing step on the difference image. This processing step ensures that the firing rate of the ganglion cell does not drop below zero or exceed its maximum firing rate. The function we chose is based on figure 5b of Chichilnisky’s paper [3]. We first take each pixel value in the difference image and scale it to lie in the range [-0.2, 0.2], and then apply the following function (C(x) = standard normal cumulative distribution function):

The function takes the following form:
Processing the difference image resulting from the convolution with this function gives an image representing the average spike rate.
Sampling
Once we have the spike rate images of ganglion cells for different receptive field sizes, we need to sample them according to the position of the ganglion cell with respect to the center of the fovea. The dendritic field size of ganglion cells and their corresponding receptive field size increases with radial distance from the fovea (eccentricity). Hence we sample the images in a circular fashion where each circle is taken from a spike rate image for a specific receptive field size. As we increase the radius of the circle, the samples are taken from a larger receptive field. The sampling idea is depicted in Figure 6.
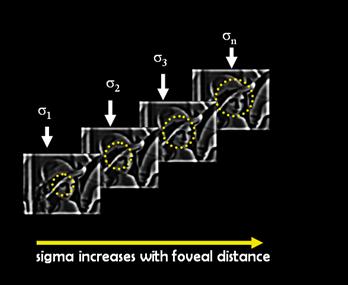
Figure 6: The
In Matlab this is done by using polar coordinates, where the pixel coordinates are described as x = rcos(θ) and y = rsin(θ). Since the coordinates are integer numbers, the x and y values are rounded down by using the FLOOR command. The sampling algorithm has two inputs:
- The number of circular levels
- The number of samples per circular level.
In our implementation, the images were uniformly sampled radially according to the number of sampling levels. A uniform angular sampling was adopted. Figure 7 shows the superimposed sampling pattern of all the spike rates for 7 circular levels and 20 samples per circle.
Figure 7: Radial sampling patterns. The samples on each circle will be taken from a different convolved image.
Mapping to Ganglion
Once we have the sampled average spike rates, we will need to find the coordinates of the ganglion cells that we will be stimulating with the optical stimulation device. There are two important considerations that we should take into account: First, there are no ganglion cells in the fovea and second, the ganglion cells are densely packed in multiple layers near the fovea. In the densely packed region, individual cell activation would be very difficult for the optical device because no single cell is capable of absorbing a large fraction of the incident light and effectively blocking the adjacent cells. For these two reasons, the optical stimulation technology should avoid the multilayer region in the center of the fovea. This region spans 3 mm in radius around the fovea [6].
In order to avoid these regions, we magnify the 5 degree (0.75 mm in radius) visual field to a region 20 mm in radius around the fovea. Since we need to avoid the multilayer region, we do not even bother sampling the points that will be mapped to this region. An alternative would have been to sample everywhere, but then discard any points that fall in the multilayer region. The mapping idea is depicted in Figure8.
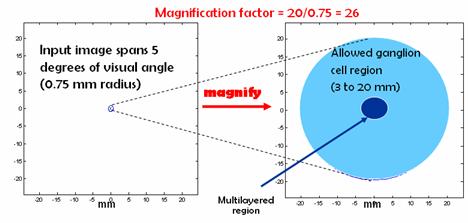
Figure 8. Mapping.
Another fact to consider is that ganglion cell density drops exponentially as we move away from the multilayered region (Figure 9 C and D).
Figure 9. The Ganglion cell density plots [6]
In our mapping scheme, we will mimic this density distribution by using concentric circles whose radii increase as powers of 2. This results in a distribution of mapped points that is denser near the edge of the multilayer region, and sparser as we move outwards. This is shown in Figure 10.
Figure 10. The
radius of the mapped cell coordinates increase with powers of 2. The ganglion
cell coordinates are in mm.
Poisson
The output of the nonlinear processing step gives the average firing rate of the ganglion cells in spikes per second. This rate becomes the input parameter (λ) for a Poisson generator. Poisson processes are often used to model neuron firing patterns. The output of the Poisson generator is a sequence that indicates the firing pattern we need to induce on the ganglion cell in order to achieve the desired visual response to our input image. The code for the Poisson process generates spikes based on exponentially distributed interarrival times. The neuron’s refractory period of 5 ms is taken into account.
Materials
General Considerations
In this section potential materials to implement our method will be described. Our goal was to design a system that would deliver light stimuli to the ganglion cells of the retina
according to the method we developed. Various constraints were analyzed and their influence on the choice of particular devices and the design of a system as a whole was considered. The constraints were divided into three groups.
First group of constraints was related to the properties of light-evoked voltage response of ChR2-expressing neurons described in [1]. Figure11 shows the voltage responses of these neurons. The experiments showed that the threshold light intensity required for producing responses in ChR2-expressing retinas was near 1014 – 1015 photons cm-2 s-1 [1]. In addition to intensity limitations, it was found that the ganglion cells expressing ChR-2 were most sensitive to the wavelength of 460nm. The spectral sensitivity is shown in Figure 12. Given these two findings, the devices suitable for our purpose had to satisfy these spectral and intensity requirements.
The second group of constraints is imposed by the dimensions of the ganglion cells and retina, and cells density distribution. The size of the human ganglion cell soma is 4-24ms on average. To maximize the effectiveness of the vision restoration device, ideally each of the cells should be stimulated individually. Therefore it is desirable for the device to produce the light beam diameter approaching the diameter of the cell. To target each cell the number of the light sources should equal the number of the ganglion cells. Since there is about a million of the ganglion cells in the human retina, targeting each cell doesn’t appear possible at the moment. What does seem possible is distributing the light beams shining on the retina in accordance to the density distribution of the cells: decreasing from fovea to periphery of the retina. Due to complex multi layered layout of ganglion cells in the foveocentric region (of diameter ~6mm [6]) the light beams produced by the device will have to be diverged properly to avoid excitation of the cells in this region.
Finally, the ergonomics considerations were taken into account. The ideal prosthesis device has to be small and light. Lower power consumption is desirable as the space to accommodate power supply will be limited. The night vision goggles (Figure 13) can serve as an example of how this prosthesis could be mounted on one’s head. On average, typical night vision goggles weigh two pounds and are not comfortable to wear for extended period of time. Therefore, using a helmet to house all device components except for the optics may solve the issue of too much weight on a persons face.
In conclusion, the block-diagram in Figure 14 describes the key elements of the potential rhodopsin based prosthesis.
Image Capture
A digital camera imbedded into the device will capture the scene in front of the person. There is a tradeoff between the size and weight of the camera and its field of view and resolution. For now, the algorithm described earlier works with 256x256 images, which allows for a low-resolution camera similar to the ones in contemporary cell phones. Higher field of view is of more importance than resolution at this early stage of this device.
Image Processing
Image captured by the digital camera will be processed with the algorithm described earlier. The final output of the processor will be a set of spikes distributed over time, which will be transformed into the input signal for the individual light sources.
Light Source
Based on the intensity sensitivity of the rhodopsin - expressing cells, the suitable light source must have the intensity no less than 1014 – 1015 photons cm-2 s-1. For comparison, the thresholds for the normal rod and cone photoreceptors are about 106 and 1010 photons cm-2 s-1. Given this high intensity requirement and the wavelength, both LEDs and lasers could serve well as the light source for the ganglion cells excitation. The preference was given to LEDs arrays, since they would take less space than lasers and consume less power, while having sufficient brightness. For the LEDs with 460nm wavelength, the brightness range from 800 to 6000mcd. To compare this with needed photon flux some calculations were done.
The following definition was taken from Wikipedia:
“The luminous
intensity for light of a particular wavelength λ
is given by
![]()
where Iv(λ) is the luminous intensity in
candelas, I(λ) is the radiant intensity
in W/sr and ![]() is
the standard luminosity function. “
is
the standard luminosity function. “ ![]() is shown in Figure 15.
is shown in Figure 15.
Both LED
brigtness and the required intensity were converted into
1) Required power
for a 24mm cell was calculated as follows:
Energy of 1015photons with wavelength 460nm is ![]() ,
,
therefore required intensity is 4.32*10-4 W/cm2. To find the power that needs to be delivered
to one cell, this result is multiplied by the area of one cell, and we get P =
1.95*10-13W .
2) To calculate how much power an LED will provide for each , first the
intensity of LED is converted from mcd to W/sr.
For an LED of Iv(460nm) =
800mcd with ![]() (from Figure 15), I(460nm) = 19.5 mW/sr.
If this LED is placed at distance r away from the cell of area S,
the solid angle was calculated as
(from Figure 15), I(460nm) = 19.5 mW/sr.
If this LED is placed at distance r away from the cell of area S,
the solid angle was calculated as
![]() .
.
For r = 2cm, and cell diameter 24mm, solid angle is 1.13*10-6sr.
Then the power that 800mcd LED can deliver to one cell will be P = 2.21*10-8W.
These calculations show that 800mcd LED can provide sufficient intensity if placed in front of the eye and focused to irradiate with the solid angle of one cell. Unfortunately, all light sources can not be places directly in front of an eye due to their large dimensions. 3mm is the smallest LED diameter available at the moment. That puts a limitation on the number of light sources the device can contain, therefore it limits the number of ganglion cells that can be activated by this device.
Currently micro LED arrays and their
fabrication is still a subject of active research [4], [5]. Once available
these arrays may have potential use in cell excitation, at the moment, however,
conventional LEDs have to be used.
Dot-matrix LED arrays are comercially available in various sizes, and an
8x8 array shown in Figure 16, is considered here as the set of light
sources.
Light Guide
To increase the number of cells that can be excited with our device, we propose to place the LED array away from the eye and have an optical system that focuses and guides the light emitted by the source. Fused-end tapers can serve very well in guiding the beam of light from the source to the eye. In general, tapered optical fibers are used to lead a collimated beam with a relatively large diameter into a smaller fiber. Therefore, the beam emitted by a 3mm LED can be coupled into a taper and output with a smaller diameter at the taper-eye interface.
Microlens array (Figure 17) can be used to couple the light beam from the LED array to the taper. Microlens arrays with 3mm lens diameter and focal length ranging from 0.02 to 20 mm are available from Epigem (www.epigem.co.uk). The shorter focal length is preferable to keep the size of the device to minimum. Tapers of various fiber sizes and geometrical configurations are available from Ceramopec and Schott (www.ceramoptec.de, www.schott.com). The fibers in the taper can be mapped from input to output in several different ways. Assuming the mapping can be customized, it is desirable to have the fibers on the square input and the round output ends to be arranged as shown in Figure 18. Such an arrangement of output fibers is based on the ganglion cell density distribution in the retina: higher density in the central region and lower – at the periphery.
Taper
to Eye Interface
Figure 19 shows the proposed optical system from light source to the eye. This system will be no longer than 10cm, depending on the choice of optics. If other elements of the prosthesis device like digital camera, processor and power supply are not placed in line with the optical system, but instead built into the ‘helmet’, this system seems to be acceptable ergonomics wise.
The output of the taper is the set of parallel beams of equal diameter that need to be diverged to target the ganglion cells distributed over a nearly spherical surface of the retina. This may be achieved with a suitable negative lens placed between the taper output and the eye. The light refraction in the eye has not been addressed in this project, it is assumed that the beam will travel along a straight from the lens to the surface of retina. To estimate how much each beam diverges traveling from lens to the retina, a Matlab function getBeamWidth was created. The function assumes the Gaussian shape for each beam, and its initial width is taken as the diameter of the taper output fiber w0. Then the width of the beam at distance z can be found as:

Assuming the 200mm diamter of the beam doesn’t change between exiting the taper and going through the diverging lens, and taking the distance between the lens and retina as 2cm, we found 0.003% increase in the beam width. If the refraction of light in vitreous is taken into consideration, the expected change in width will be greater. However, amongst different limitations of the proposed device, the issue of light refraction in the vitreous is not of great importance.
Figure 19.
Optical system for the prosthesis model.
Losses
The losses of the proposed device will be composed mainly of the losses from the LED-taper coupling and taper to the eye coupling. The loss estimation was not addressed in this work since the intensity of LED is several orders of magnitude greater than the required intensity, therefore losses in the device will not affect the light stimulation of the ganglion cells. Extensive losses may harm the device, however, and it will be important to consider the issue in the future.
Conclusion and Discussion
One of the really interesting
things about this project is the tremendous span of topics it encompasses, from
the molecular level of the operation of ChR2 and neuronal firing, to the
cellular level of processing in the retina, to the level of optical
devices. Given such complexity, we had
to make many simplifying assumptions in our analysis.
Some possible areas for future work on this project include:
- Color vision and motion perception restoration
- Considering both on-center and off-center ganglion cells
- Using more complicated sampling and mapping schemes to better reflect the distribution of ganglion cells.
- Considering how experiments in normal human subjects could be conducted using distorted stimuli to determine the effect of remapping the response to different locations on the retina.
- Considering the effects of distortion caused by the optics of the eye
- Considering alternative optical stimulation methods
Acknowledgements: Brian Wandell, Jonathan Winawer, Joyce Farrel,
E.J. Chichilnisky, Aykut Koc
References
[1] Bi, Anding et al. “Ectopic expression of a microbial-type rhodopsin restores visual responses in mine with photoreceptor degeneration.” Neuron. 50: 23-33. (2006)
[2] Boyden, Edward S., F. Zheng,
[3] Chichilnisky, EJ. “A simple white noise analysis of neuronal light responses.” Network Computation in Neural Systems. 12: 199-213. (2001)
[4] Choi,
H.W., Jeon, C.W., Liu, C.,
[5] Choi,
H.W.; Jeon, C.W.; Dawson, M.D.; Edwards, P.R.; Martin, R.W., “Fabrication and performance of parallel-addressed
InGaN micro-LED arrays“, Photonics Technology Letters, IEEE, 15:
Issue 4, Apr 2003 Page(s): 510 - 512
[6]
[7] Harman A., Abrahams B., Moore S., Hoskins R., “Neuronal density in the human retinal ganglion cell layer from 16-77 years”, The Anatomical Record, 260: Issue 2, Pages 124 - 131
[8] Kolb, Helga. “How the retina works.” American Scientist. 91: 28-35. (2003)
[9] Rodieck, R. W. The
First Steps in Seeing.
[10] Wandell, Brian A. Foundations
of Vision.
[11] Zrenner, Eberhart. “Will retinal implants restore vision?” Science. 295: 1022-1025. (2002)
http://www.nei.nih.gov/news/pressreleases/032002.asp (statistics on eye disease)
http://www2.psych.purdue.edu/~gfrancis/Classes/PSY310/L06b.pdf (nice pdf on receptive fields)
Appendix 1 List of Matlab Files: Rhodopsin code
Related to Processing:
createRField
This function creates two Gaussian receptive fields corresponding to center and surround fields
nonlinear
Applies the nonlinear function to the spike rate change.
makeCircularGrid
This function creates the circular grid that samples the convolved images
(spike rate images after the nonlinear mapping) on the circular grid, and
does the remapping of the ganglion cells (magnification + avoiding
multilayer region)
poissonSpikeGenerator
Creates the spike pattern based on the average firing rate
runCode
This is the main code of our algorithm where it will go through the
different step involved in creating the light patterns that we shine
on the ganglion cells. The steps are:
1)
Load the image, 2)Convolve with different Gaussians, 3) nonlinear 4)
sample
5) map
ganglionResponse
This is the main code that
generates the gui by calling several function including runCode.
Related to Device:
getBeamWidth
This function calculates the width of the beam at distance z given
initial width, wavelength and the distance.
getPower_onCell
This function returns the total
power from LED, delivered to the ganglion cell of particular diameter, and
compares it to the power required based on the rhodopsin properties.
Appendix 2 Processing GUI
·
Download and unzip the folder containing the code: Rhodopsin code
·
Change the directory to where you downloaded the code
·
On the command line type: >> ganglionResponse
·
This should open the GUI:
·
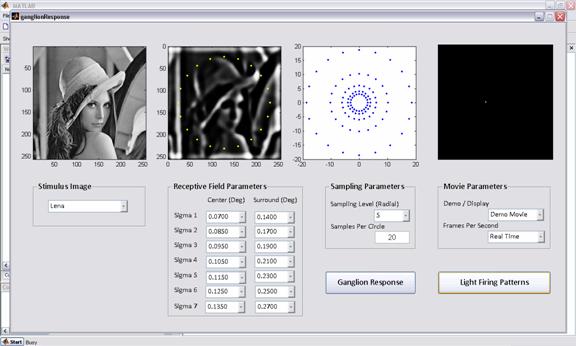
- Choose a stimulus image from the drop
down menu, the first image from left should show the stimulus image
- Assign the sampling parameters, number
of sampling levels (L) and the number of samples per circle
- Assign the receptive field parameters
for L number of sigma center – sigma surround pairs. The drop down is set
to range from 0.02-0.5 degrees.
- Press the button “Ganglion Response”
- The second image from left shows the
average spike rate for every level of sampling (coordinates in pixels)
- The third image shows the final
coordinates of targeted ganglion cells in the retina after remapping
(coordinates in mm)
- Press the button “Light Firing Pattern”
to see a sample firing pattern of lights in the fourth image.
Appendix 3 Work breakdown
Maryam Etezadi-Amoli: Matlab processing code, writeup, presentation
Sharareh Noorbaloochi: Matlab processing code, writeup, presentation
Khurram Zia: Matlab processing code, writeup, presentation