Characterization of variable colour effects in ISET lens
model
To
identify the severity of the colour distortion in current devices, we first
investigated the problem in the ISET environment. An advanced lens model was used that contained
wavelength-dependent effects (both blurring and photon loss). The script that
generates this advanced lens model is included in the appendix.
While wavelength-dependent
effects were included in this model, position-dependent were not. As such,
position-dependent effects were produced by running the lens model with 3
different distortion factors: low distortion (image centre), medium distortion
and high distortion (image periphery).
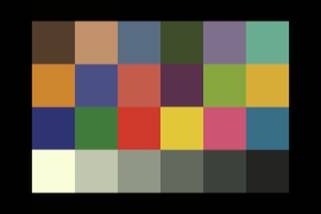
Figure 1: Macbeth
scene under low lens distortion. This image was used to represent the center of
the image where distortion would be small.

Figure 2: Macbeth scene under medium lens
distortion.
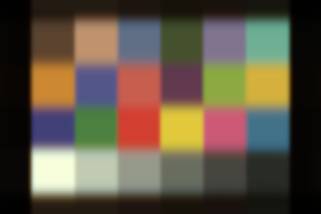
Figure 3: Macbeth scene under high lens distortion.
This image was used to represent the periphery of the image where distortion
would be high.
ISET was
then used to find the colour balancing matrices required to restore the correct
colours for the Macbeth colour charts. The results are shown below for both a
pixel size of 2.8um and 1.4um.

At first
glance, the matrices look very similar. The matrix coefficients themselves do
not vary greatly. For example, the main diagonal values change by less than 2%
in all cases.
While the matrices do not seem to
change much, a quantitative way of analyzing the colour balancing differences
is required. As such, we applied the matrices for a distortion factor of 0.1
and 1.0 to a range of colours and observed the resulting delta E changes. The
colours were randomly sampled, and the results are shown below. A white point XYZ
of [95.0399,100,108.8932] was
used.
|
Colour (RGB) |
Delta E of Colour-Balanced RGB |
|
100,40,30 |
44.4253 |
|
100,200,50 |
30.1294 |
|
40,70,55 |
12.4634 |
|
10,10,10 |
8.0201 |
|
30,150,200 |
1.5541 |
|
200,150,50 |
1.4969 |
There
are several important findings in these results:
- The differences in the
colour balancing matrices are significant enough that they can sometimes
cause visually perceivable colour changes. (Delta E of 5 or greater is
assumed to be visually perceivable).
- Using a smaller pixel size makes
the problem worse, but not by a significant amount (changes matrix values
are still limited by 2%).
- The distortion is NOT linear.
Some of the values of the matrices for the medium blur factor are higher
or lower than the values for both the other matrices.
To
further determine what is actually happening in the colours, we sampled the SPD
at the centre of the white block in the Macbeth colour chart. The results are
shown in figure 4 below.
high distortion medium distortion low distortion
![]()
![]()
![]()
Figure 4: SPD of white block in Macbeth
colour chart under low (blue line), medium (green line) and high (red line)
distortion
From
this SPD we can see that there actually is a colour change. This is because
there is a wavelength-dependent photon loss which is changing the shape of the
SPD. Note that the SPD gap is widening as wavelength increases.
Thus,
there are two visible effects caused by the lens
●
Color blending
at boundaries due to blurring
–
This cannot be corrected by colour balancing.
Colour balancing cannot unblend the colours.
●
Photon loss caused by the lens model (wavelength-dependent)
–
Causes true colour change
In summary, variations in colour balancing matrices
exist, but these variations only sometimes result in visible changes. Even in
the worst cases of a delta E of approximately 50, the colour change is not drastic.
The question then becomes: are the changes pronounced enough to warrant use of
a variable colour balancing matrix? In the end, there is a tradeoff:
true colour accuracy vs processing time/effort.