Experimental Methods
Distortion
Distortion is most apparent when there is a repeating pattern in the image. We printed and photographed the following test pattern to quantify the distortion:

There were many considerations for quantifying the distortion in the image. The test pattern needed to be flat. Any distortion in the original image would cause the results to be invalid. The camera needed to be pointed normal to the test image. Any angle off of normal would introduce a perspective distortion which would again cause an offset to the results. Sufficient lighting was also necessary to obtain an image that had a detectable contrast. If there was not enough contrast, then the Matlab code would not be able to identify the points in the image for analysis.
Proper test conditions were obtained through the following method:
1. The test image was mounted on the wall.
- A tripod was used to provide a stable platform for the camera.
- A level was used to properly align the test image so that the line near the middle of the image was parallel to the horizontal.
- A level was also used to set up the camera at right angles to the test image.
- Lighting was provided by a tungsten lamp. This lamp was bright enough to provide sufficient contrast in the image.
Once the test image and the tripod were set up, we would take many images with a camera. We changed the optical zoom in order to see if there was a change in the distortion for focal lengths. This set up was used for both cameras. We hoped to take similar images for the two cameras under the same geometry and the same lighting conditions.
Light Falloff
Uniform illumination was necessary to measure the light falloff of the two cameras. To this end, we used an integrating sphere to provide uniform illumination. The integrating sphere diffused the light from a tungsten lamp and the pictures were taken at the output port of the integrating sphere. Care was taken to keep stray light to a minimum.
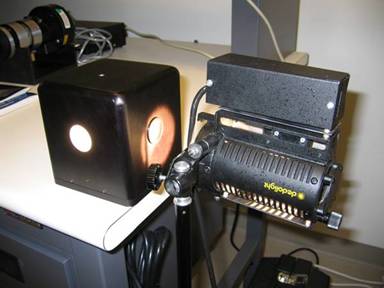
For each camera, we took two pictures at each f-stop value to try to separate the effects of optical vignetting and natural vignetting. With a uniform light output from the integrating sphere, the mounting of the camera was not critical to these images.
Proper test conditions were obtained through the following method:
1. The tungsten lamp was mounted at the entrance port of the integrating sphere.
- The camera was held at the output port of the integrating sphere. The aperture was inside the output port to minimize the stray light from the lamp.
- The room lights were turned off to decrease the amount of stray light.
- Two pictures were taken at each f-stop.
Originally, the images were thought to be completely saturated, but this was an artifact of the LCD screen on the camera.
Image Sharpness
In order to have another metric with which to compare the two cameras, we took images to test the spatial frequency response. The following image was used for this test:

The edge of this image provided a good mark to test the spatial response of the camera.
In order to obtain good test images we needed proper lighting, a steady camera, and a steady test image. This image was mounted on the wall and the camera was mounted on the tripod to take proper test images. The lighting was provided by a tungsten lamp which gave good even illumination.
Proper test conditions were obtained through the following method:
1. The test image was mounted on the wall.
- A tripod was used to provide a stable platform for the camera.
- A level was used to properly align the test image so that the marks on the edge aligned the image at a 6 degree angle.
- A level was also used to set up the camera at right angles to the test image.
- Lighting was provided by a tungsten lamp. This lamp was bright enough to provide sufficient contrast in the image.
The analysis software we used needed the image to be tilted at 6 degrees and this tilt was easily introduced by lining up the marks on the edge of the image.
Three picture of the test image were taken with each camera. The zoom was increased to see if sharpness had any dependence on the zoom.
Back to Table of Contents