Method
A square grid was created using Imatest and printed using a laser printer. A third order calculation was chosen to compare the relative distortions between the two cameras.
ru = rd + k1 rd3
ru is the undistorted distance from the center
rd is the distorted distance from the center
k1 > 0 indicates barrel distortion
k1 < 0 indicates pincushion distortion
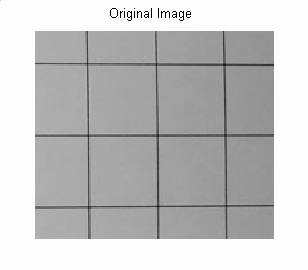
To find the distances from the center, the cross points of the grid is needed. First, for a faster calculation, the images are resized to 750 x 1000 pixels and for a comparison with the Imatest results, the images are cropped to only include complete row and columns. To calculate this, the images are read into Matlab using the imread function in the Image Processing Toolbox. The image is also converted to a gray scale image in double form.
BW image = rgb2gray(color image);
Output =double(Input);
Next, the edges of the image are found by the edge function:
Output = edge(Input, ‘sobel’)
Edge returns a black and white image of the same dimensions, with 1(white) for an edge, and 0(black) elsewhere. There are six different edge finding methods, and after trying all six on several images, the sobel was chosen because it returned the best results for our purposes. Sobel calculates edges by approximating the derivative and returning the maxima of the gradient.
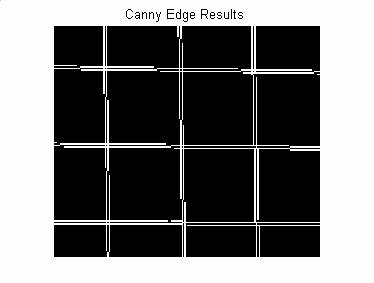
However, as you can see, there is a thickness associated with the line itself, and the lines are not straight throughout the image. To find the cross points, the pixels in the image are looped through to find points where there are white regions within a 10 x 10 pixel square. This results in multiple cross points where there should only be one.
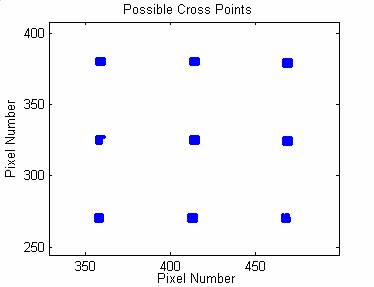
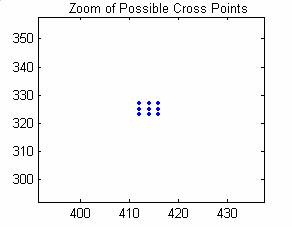
To approximate where the actual cross points are, these points are averaged down to a single point. The possible cross points are separated by row groups in a struct form. Row groups are found by finding where the row values change by more than a set threshold, for example, 5 pixels. Within a row group, values are sorted by the column value to separate column groups. Values within the same row and column group are then averaged.
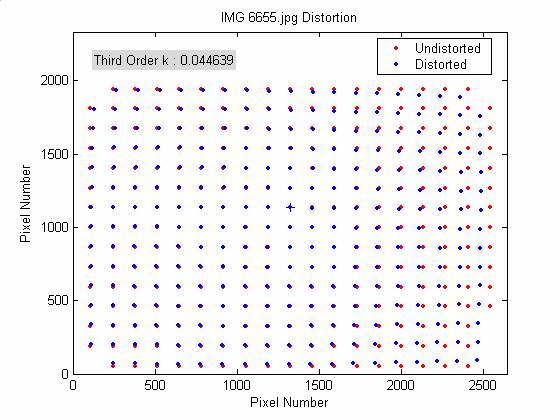
Finally, the center point of the image is found and indicated with ‘+’. The center point is estimated as the middle row group, and the middle column of that row group. The expected undistorted column separation is calculated by taking the average between the space between the center and the column on its left, and between the center and the column on its right. The expected row separation is found similarly. Extending out from the center point, the expected undistorted grid is plotted.
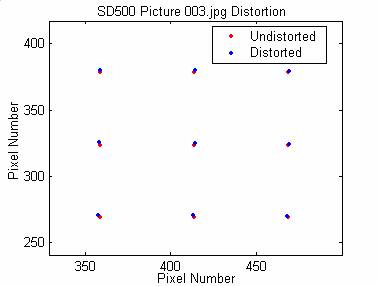
Finally, the ru and rd are found as the distance between the cross points and the center point. The k1 distortion value is calculated for each cross point through k1 = (ru - rd ) / rd3 , the overall k1 value is taken as the average over all cross points.
Results
The Matlab distortion code correctly identified the barrel distortion (k1 > 0) visible by observation. Generally, there is an approximate 10 % difference in k1 distortion values between the written Matlab code and Imatest’s results.
The table below summarizes the results over several images taken under the same conditions. In comparing the two cameras, Matlab code and Imatest agree that at no zoom, the Canon S50 has slightly more barrel distortion than the Canon SD500. However, the results at 3x zoom shows the contrary, but this may be due to the larger error associated with smaller absolute differences.
The 3x zoomed image results are useful in checking that the distortion significantly decreases, as expected due to the narrower field of view for a larger focal length.
|
S 50 |
Matlab |
Imatest |
|
IMG_6655 |
0.044639 |
0.0379 |
|
IMG_6656 |
0.041174 |
0.03711 |
|
IMG_6657 |
0.038369 |
0.0366 |
|
IMG_6658 (3x zoom) |
0.01187 |
0.0133 |
|
IMG_6659 (3x zoom) |
0.01152 |
0.0122 |
|
SD 500 |
Matlab |
Imatest |
|
IMG_2877 |
0.033277 |
0.0344 |
|
IMG_2878 |
0.032662 |
0.0366 |
|
IMG_2880 |
0.043518 |
0.0356 |
|
IMG_2881 (3x zoom) |
0.01903 |
0.0162 |
|
IMG_2882 (3x zoom) |
0.011584 |
0.0161 |
|
IMG_2883 (3x zoom) |
0.010738 |
0.0104 |
It was also interesting to note that the calculated k1 values differed slightly depending on the number of pixels in the image. There was roughly a 30% fluctuation between the calculated distortion coefficients of the 3072 x 2304 (7 MP), 2592 x 1944 (5 MP), and 1000 x 750 dimensions. Over dimension variation, the Matlab code varies by 5% while Imatest’s values vary by 15 %. However, this is only for one particular example. I would expect the image of the largest dimensions is more accurate since more detail is involved. Although these fluctuations demonstrate that the distortion values are not extremely accurate, they are still good for estimating the relative distortion between different images.
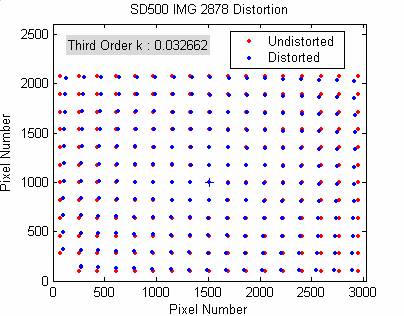
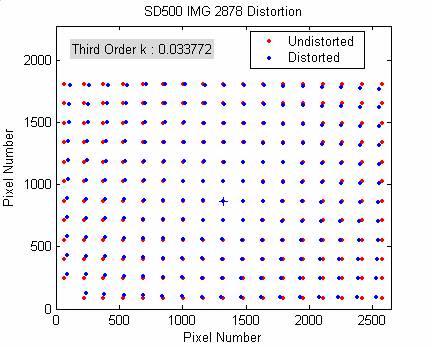
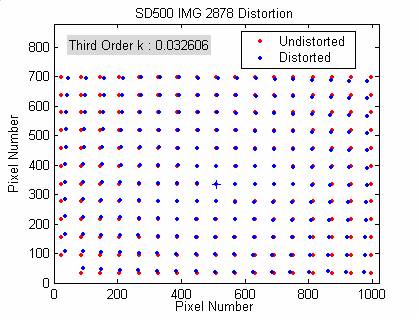
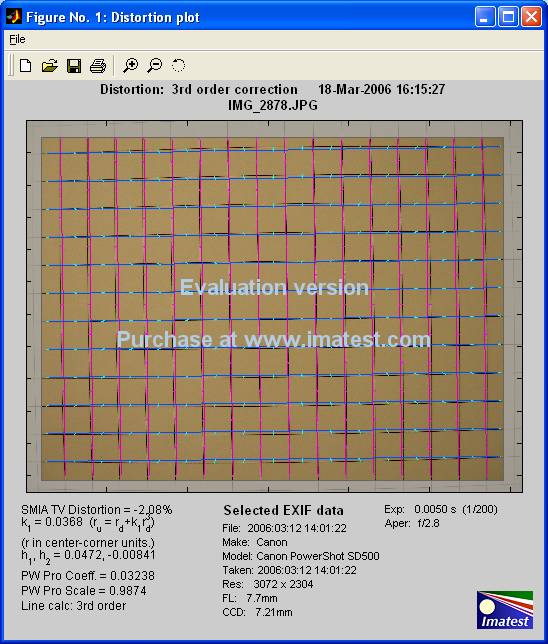
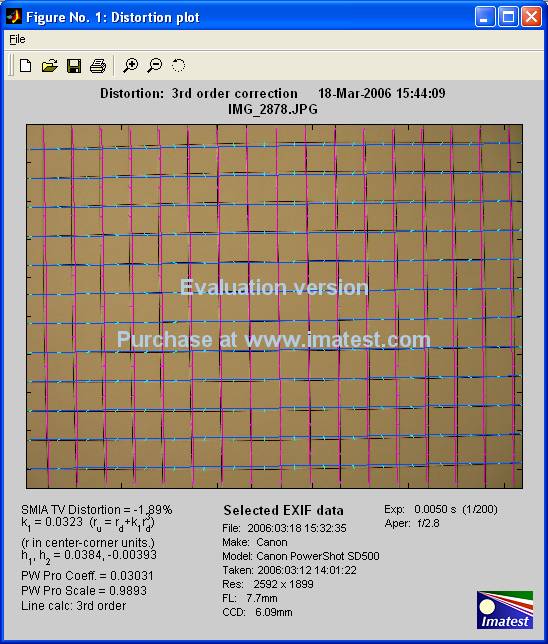
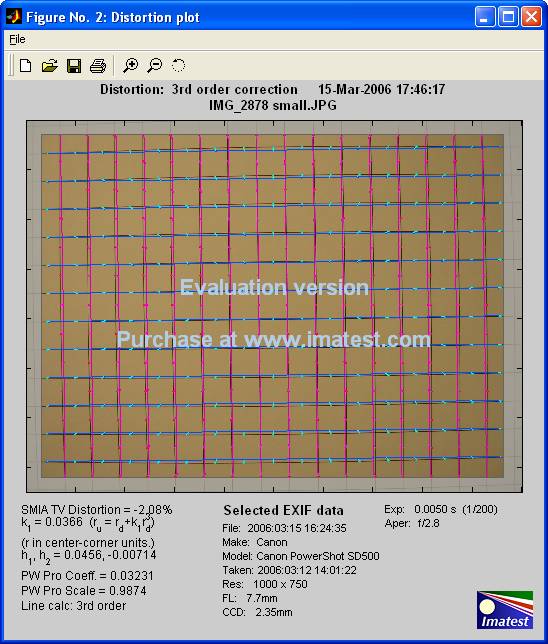
The following table and figures show the results obtained for one particular image, at three different dimensions: 3072 x 2304, 2592 x 1944, and 1000 x 750. These images were resized in Adobe Photoshop. When the resize function in Matlab was used, the edge detection no long worked. The resizing in Adobe Photoshop appears to retain more of the necessary information.
Results for SD500 IMG_2878:
|
|
Matlab |
Imatest |
|
3072 x 2304 |
0.0327 |
0.0368 |
|
2592 x 1944 |
0.0338 |
0.0323 |
|
1000 x 750 |
0.0326 |
0.0366 |
Note, the center cross
point may look off center due to the extra text added at the top of the figure.
The following figures show the Imatest results for the same three images.
Conclusions
Although for comparisons, the Canon SD500 images were resized to 5 MP to match the Canon S50, the range of focal lengths for the two cameras are slightly different. This was slightly corrected for by cropping the images so the two cameras show similar portions of the original image, however, it is not exact. The observed differences in k1 could be due to the slightly different focal lengths.
There are several problems with the distortion code. The distortion values were heavily dependent on the location of the cross point. If there is a low, even number of rows or columns, the center point can be significantly shifted. Having an incorrect center point meant the expected row and column spacing was also incorrect.
The code also does not account for slight tilts in the images. This effect is apparent in some images, where there appears to an angle between the best fit line for the distorted and undistorted cross points. This could be corrected by rotating the image using Adobe Photoshop.
There were several images that appeared to have a much larger distortion on the right versus the left side, which indicates either an incorrect center point, or an image taken at an angle from the image plane. This could be corrected by manually adjusting the location designated as the center point. A better way (as suggested during our presentation) would be to find the center point from the optical axis, the straight line which passes through the center of curvature of the lens.
Unfortunately, the distortion results were not particularly conclusive. Improvements should be made in the data gathering process, to further ensure the conditions are the same between images. A level was used to make the camera parallel with the image on the wall, but it was hard to check if the camera’s image plane was parallel with the wall plane. It would also be good to find a way to make sure the images are taken at the same focal length. Using different cameras may solve this problem, since the focal length could not be controlled in the Canon SD500.
Improvements to the code would be to include tilt and angle correction. This may be achieved by fitting lines to the cross points, and finding the slope of these lines. The estimated undistorted cross points could then be based off the fitting line. Another improvement would be to correct for the vignetting before calculating the distortion. In most of the images, the points in the corner are missing because vignetting effects and/or the tungsten lighting did not provide enough image contrast.
Hopefully after these improvements are made, the distortion coefficients could be more conclusive.
Back to Table of Contents.