Image Sharpness Results
The Canon SD500 images were
resized to 5 MP for the same dimensions as the Canon S50. In Imatest, a 200x100 pixel region was
selected, consistently in the same area of the image. Imatest then outputs all
the calculations.
The Canon SD500 had
consistently smaller 10 – 90 % rise distance and larger MTF50, but higher
chromatic aberration than the Canon S50.
The ideal conditions are a
short 10 – 90% rise distance, high MTF50, steep edge profile, broad frequency
spectrum, and minimal chromatic aberration.
In the edge profile plots,
the black line indicates the original edge profile for the image, while the red
dotted line indicates the edge profile after standardized sharpening, to
provide a normalization between different cameras. If the red and black lines are similar, it
means the image processing of the camera did not try to over sharpen the image.
The MTF50 is defined as the
spatial frequency where the image contrast drops to 50% of the maximum
contrast. A higher cycle per pixel value
means that the lens can resolve higher spatial frequencies and therefore will
allow finer resolution in the image.
To quantify the chromatic
aberration, the edge profiles are plotted separately for the R, G, and B
channels. The chromatic aberration is
then taken to be proportional to the area between the channels with the highest
and lowest amplitudes. If the
differences between the different channels is very large, there may be some
“purple fringing” effects.
Below is a summary of image
sharpness calculations for several images taken under similar conditions:
|
SD500 |
10-90% rise (pixels) |
MTF50 (Cycles/Pixel) |
Chromatic Aberration (area in pixels) |
|
IMG_2890 |
1.12 |
0.416 |
0.197 |
|
IMG_2891 |
1.1 |
0.418 |
0.206 |
|
IMG_2892 |
1.06 |
0.429 |
0.193 |
|
IMG_2893 (3x zoom) |
1.9 |
0.304 |
0.808 |
|
IMG_2894 (3x zoom) |
1.8 |
0.317 |
0.851 |
|
S50 |
10-90% rise (pixels) |
MTF50 (Cycles/Pixel) |
Chromatic Aberration (area in pixels) |
|
IMG_6681 |
1.35 |
0.334 |
0.0855 |
|
IMG_6682 |
1.33 |
0.334 |
0.165 |
|
IMG_6683 |
1.33 |
0.348 |
0.201 |
|
IMG_6684 (3x zoom) |
1.92 |
0.28 |
0.124 |
|
IMG_6685 (3x zoom) |
1.95 |
0.28 |
0.211 |
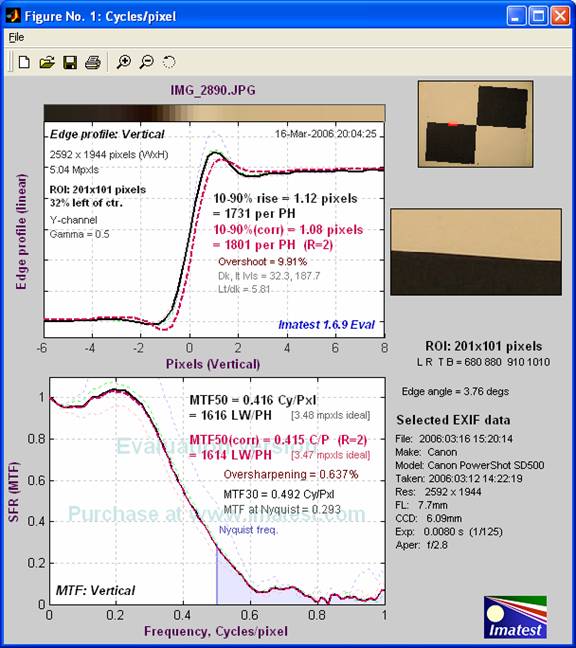
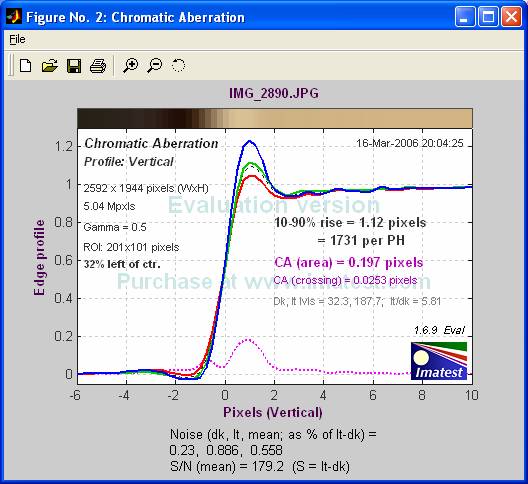
Image Sharpness Conclusions
We believe Imatest did a very
good job at calculating the parameters to quantify the image sharpness. We did not write our own code, so there is no
comparison to be made.
On a review site, www.dpreview.com, they suggested that the
Canon S50 (5 megapixels) was more rushed to production, compared to the Canon
S45 (4 megapixels), so although the sensor was upgraded, the benefits of the
sensor in relation to the lens was not optimized. This resulted in images that are not as
sharp, and with more chromatic aberration than expected. This agrees with our findings for the edge
profile and MTF results. However, there
is no way to confirm that it is due to un-optimized conditions.
Back
to Table of Contents.