Analysis of Color Blindness
Project Writeup
Introduction
Color vision deficiency is quite common, about 8% of the males have color blindness to some degree. These people see things differently than normal people do. This fact, however is rarely considered in the design of web pages. People having color blindness are prone to missing some information that is conveyed by color. Consider how frequently we need to use the Mapquest to get driving directions and see local maps. Since almost all of these images are available digitally, a technique would be very useful to have to somehow “enrich” the picture so that color blind people get more of these pictures.
The goal of this project is to analyze how color blind people perceive colors in the world, and to make a simulation so that people with normal vision can understand what they see. That will help designers of web pages with choosing the colors they use in their designs. We also would like to make certain modifications in digital pictures to make life easier for the color blind people who use them. Our technique has applications to websites, color printing, and presentations.
Many research groups have conducted research on how to model the visually impaired vision, and published a number of papers presenting some algorithms to simulate what color-blind people see [1-7]. One such simulation program that has gained popularity is the Vischeck site (www.vischeck.com). This site also provides a model for daltonization, technique to modify a picture so that it is more visible to the visually impaired. In this project, we used the simulation data of [1,2] to generate a Matlab code that simulates how a color image is perceived by color blind people. Moreover, we generated a transformation code that daltonizes the digital image. We compare our results to those we get from the Vischeck site. The results we get turn out to be in reasonable agreement for both the color blindness simulation and daltonization. The algorithm was also verified by a fellow student who has color blindness. Hence we conclude our relatively simpler daltonization algorithm can be used to improve web site visibility for the color blind.
Methods
Color vision is achieved through the L, M and S cones in the human retina. These photosensitive receptors are sensitive to the long, middle and short wavelength ranges of the visible spectrum, respectively. Color blindness is the result of a deficiency of one (or more) of these photoreceptors. There are three typical kinds of color-blindness: protanopic, deuteranopic, and tritanopic, which correspond to the deficiency of the L cone, M cone, and S cone. These people have problem perceiving the full spectrum of colors normal people can distinguish.
The basic idea of our algorithm is first to find the LMS values of the RGB (red-green-blue) image using some conversion matrix commonly used in the literature [1]. The LMS values correspond to what is received at the level of the retina. RGB, on the other hand, corresponds to the phosphor levels on a cathode ray tube screen to match the colors, and is used to define digital images. In the next step we make a conversion to delete the information associated with the loss of any of the cone types to get the modified LMS values L’M’S’. Finally, we make a reverse transformation on the L’M’S’ values to get the R’G’B’ vales. R’G’B’ presumably represent how that specific color RGB is perceived by a color blind person. When this operation is done for all the pixels, the image is converted.
We used the algorithm presented in [1] for the color-blindness simulation. As explained above, this involves a RGB to LMS transformation. This linear transformation can be achieved by a matrix multiplication., which is provided in [1]. The algorithm prepared in Matlab first takes in an image using the imread command and generates a matrix with the RGB values for each pixel. Then using the RGB-to-LMS matrix, this data is transformed into the LMS space. After obtaining the LMS value, the critical step comes, where we delete the information corresponding to one of the cone types. The transformation is done by considering the LMS color space in Fig.1.
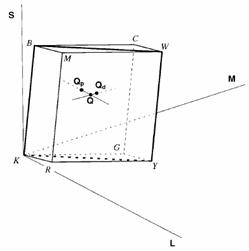
Figure 1. The LMS Color Space
In Fig, 1,, B indicates blue, K black, W white, R red, G green, C cyan, M magenta, and Y for yellow. For a normal person, the color space spans over the KBMRGCWY parallelepiped. For a protanope, all the colors which are on QpQ line will appear the same, which is the intersection color of QpQ and KBWY plane. Similarly, for a deuteranope, all the colors which are on QdQ line will appear the same, which is the intersection color of QdQ and KBWY plane. Clearly, information outside KBWY plane is lost for protanope and deuteranope. The KBWY can be expressed as a plane equation:
αL+βM+γS = 0
which passes through the points (0,0,0), (LB, MB, SB), (LW, MW, SW). Solving α,β,γ using these three points, we can obtain
α =MWSB - MBSW
β = SWLB - SBLW
γ = LWMB - LBMW
Therefore, we can find Lp for protanope and Md for deuteranope:
Lp = -(βM+γS)/α
Md =-(αL+γS)/β
which are the L cone response for a protanope and the M cone response for a deuteranope. The symbolic parameters are a function of the phosphor intensity functions of the specific CRT monitor used, and should be experimentally determined. In our simulations, we assumed a generic monitor.
The code finally converts the image back into the RGB domain and it could be saved as a jpeg file for review.
The basic idea behind daltonization is to calculate the error matrix, which is the image consisting of R’G’B’ values subtracted from the original image. This represents the information lost during the transformation. In other words the error picture is what cannot be conveyed to a color blind person. We make a linear transformation on this picture so that it can be conveyed, and add this on the original picture to find the daltonized image. For example, if the L cone is missing (protanope) the person will have difficulty in seeing the red part of the spectrum. Consequently, in the simulation, the error picture will consist of red shades mostly. Our transformation maps this information to the blue side of the spectrum. When this is added on the original picture we will get a daltonized version. The visibility of this image, therefore, is increased for a protanope.
Results
We used sample pictures to test the effectiveness of our algorithm. We found good agreement with the results of [1,2] and the vischeck web site. Figures 2-6 show examples of these comparisons. Our daltonization algorithm results in blue cast over the original red color for protanope conversion (see Fig 5, for example). This may cause problems with pictures originally having blue. On the Vischeck website, however daltonized pictures as they are perceived by visually impaired people show white in the red region.
Figures 2 and 3 compare the results of our code and the Vischeck site on a spectrum of colors. It is readily seen that the red region is transformed into blue using our daltonization algorithm.
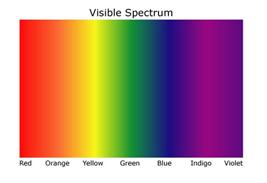
(a) (b)
(c)
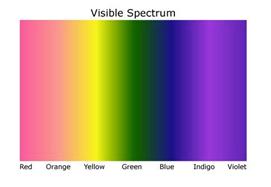
Figure 2. (a) Original Spectrum, (b) Daltonized Spectrum with Error-Transform Algorithm, and (c) Daltonized Spectrum Perceived by a Deuteranope. In (b) and (c) our algorithm is used.
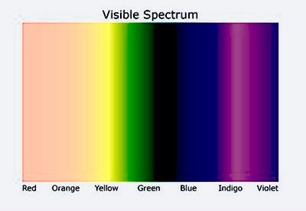
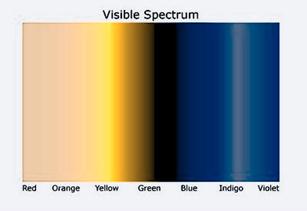
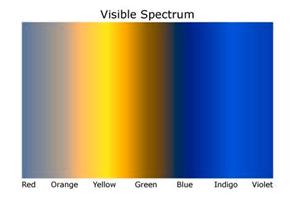
Figure 3. Daltonized Spectrum with Vischeck Algorithm (top) , and Daltonized Spectrum Perceived by a Protanope (bottom). These simulations are done using the Vischeck website.
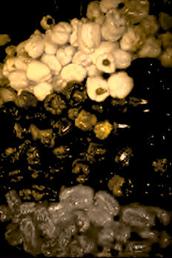
Comparing the results of the vischeck website with ours, in the vischeck results we notice a black region in green-blue part. Consequently, daltonized picture perceived by color-blind people loses all the information in this region when the Vischeck algorithm is used. Our error-transform algorithm shows less information loss in this region. This effect is more readily observed in Fig. 4, where the green pepper is completely blacked out when the Vischeck algorithm is used.
(a) (b) (c)
Figure 4. (a) Original image (b) Daltonization with the Vischeck Algorithm (c) Daltonization with our algorithm.
In Fig. 5 we see an interesting effect. Our error-transform algorithm shows a blue cast with a picture with a lot of red:
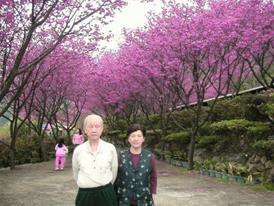
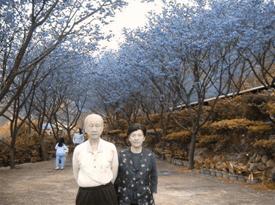
(a) (b)
Figure 5. (a) Original picture (b) Daltonized Picture Perceived by a Deuteranope
(a) (b)
(c) (d)
Figure 6. a) Original b) Daltonized by our Error-Transform algorithm c) Picture b Perceived by a protanope c) original image daltonized by Vischeck, and perceived by a protanope
Conclusion
In this project, we developed an algorithm to simulate how color blind people see the world. With the algorithm, an RGB image is converted into the LMS space, where the information corresponding to the missing cone type is deleted. Converting this image back to the RGB plane, we obtain the modified picture. We developed another code to daltonize images so that more information can be conveyed to a color-blind person. In this, the error picture, which is obtained by subtracting the modified picture from the original, is further processed and the colors are mapped to some other part of the spectrum so that they can be perceived by color blind people. Our results are verified by a cross check with the results obtained from the Vischeck web site. The error -transform algorithm we developed for daltonization can be further modified such that the color mapping is determined according to the color content of the original picture. This can be done by simply trying different values for the parameters we use in the transformation matrix, and find out how the values affect the spectrum. Another work to be done is to make the picture look more natural. Some people, including protanopes and deuteranopes, have complained that pictures appear abnormal after daltonization. In order to solve this problem, we need to find a way to redistribute the color spectrum which is closer to the normal one. For that purpose, working on the LMS space may not be suitable, and CIELAB should be considered as an alternative. In conclusion, our simple algorithm can provide reasonably satisfactory results for the purposes of web page design.
References
1.
Viénot F, Brettel H, Ott L, Ben M’Barek A, Mollon JD.
What do colour-blind people see? Nature
1995;376:127–128.
2.
Brettel H, Viénot F, Mollon JD. Computerized simulation of color appearance
for dichromats. J Opt Soc Am A 1997;14:2647–2655.
3.
Viénot
F., Brettel H., and Mollon J. D., "Digital video colourmaps for checking
the legibility of displays by dichromats", Color Res. Application, 24,
pp243-252, 1999. http://tsi.enst.fr/~brettel/colourmaps.html, 1999.
4.
Viénot F, Brettel H. Color display for dichromats. Proc. SPIE Vol. 4300 (2001) 199–207
5.
Capilla P, Diez-Ajenjo M A, Luque M J and
Malo J 2004 Corresponding-pair procedure: a new approach to simulation of
dichromatic color perception J. Opt. Soc. Am. A 21 176–86
6.
Capilla P, Luque M J and Diez-Ajenjo M A 2004
Looking for the dichromatic version of a colour vision model J. Opt. A: Pure Appl. Opt. 6 (2004)
906–919
7.
Stokes M,
8. Vischeck website: www.vischeck.com
Appendix I
Matlab code can be downloaded from:
This report can be downloaded from:
Project presentation can be reached at:
Appendix II
Work Breakdown:
We worked on the project altogether most of the time. The matlab code was developed by Onur and Poliang. Nevran worked on the references to understand the psychological and biological foundations of color blindness. Poliang and Onur investigated and evaluated different algorithms available in the literature. The presentation and the report are joint work.