Kristin Granlund and Mariel Velez
16 March 2005
Introduction
The goal of this project is to calibrate an Iiyama
HM204DT
CRT monitor for use in Drosophila visual behavior experiments. Our
specific
aims are:
As fledgling neurobiologists we are compelled to ask questions that get at the heart of how the brain processes information. How does the brain compute the wealth of data available in the environment? How do neurons represent this information and how do they computationally relay this information to other neurons? How do these neuronal calculations translate into a sensory percept?
The computational properties of the visual system have fascinated and perplexed scientists since the inception of neurobiology as a field of study. In general, vision science has been approached from two main scientific roads: 1) psychophysics, which has characterized many human visual behaviors using precise stimuli and mathematical modeling of neuronal circuitry, and 2) neurophysiology, which has directly studied the activity of neurons in the monkey visual system. Due to experimental limitations inherent in both of these methods, however, we are still left many questions: How is visual information ciphered by a neural circuit and how do these computations contribute to visual perception?
In order to tackle these questions, our laboratory uses the Drosophila visual system as model neural circuit. Drosophila is an ideal model system in many respects because flies exhibit several intriguing visual behaviors (Heisenberg and Buchner, 1977). In addition, Drosophila offers a wealth of genetic tools that allow us to dissect neuronal pathways in vivo (see Genetics appendix III for more information). My project will focus on how the Drosophila visual system encodes and computes color information.
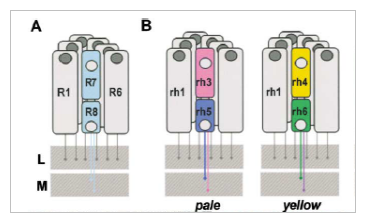
Do flies have the visual equipment necessary for mediating color vision? Physiological and anatomical evidence suggests that they do. The Drosophila compound eye contains an array of 800 simple eyes or ommatidia, each containing eight photoreceptor neurons (R cells). Six of these R cells, designated R1-R6, express a blue/green absorbing rhodopsin, Rh1 (O’Tousa, 1985, Feiler 1988, Zuker 1987) (Fig 1). The R7 cell in each ommatidium expresses either the Rh3 or Rh4 rhodopsin, which both absorb light in the UV range. The R8 cell expresses either the Rh5 or Rh6 rhodopsin, which absorb light in the blue and green range, respectively. There are three kinds of ommatidia in the fly: one kind expresses Rh1 in R1-R6, Rh3 in R7, and R5 in R8. These are the “pale” ommatidia and represent about 30% of ommatidia in the eye. The second kind expresses Rh1 in R1-R6, Rh4 in R7 and Rh6 in R8. These are the “yellow” ommatidia and represent about 70% of ommatidia in the eye (The third kind of ommatidia are only at the dorsal rim of the fly eye and respond to polarized light).
While having photoreceptors that are spectrally distinct is an important prerequisite for color vision, it is not the only one: the photoreceptor output signals must also be compared somewhere along the visual pathway in order for the fly to perceive color. While there is scant physiological evidence that this computation occurs, a few behavioral studies have suggested that flies can distinguish between two colored cues (Schumperli 1973, Menne and Spatz 1976, Tang and Guo 2001). Furthermore, the anatomical organization of the Drosophila visual pathway supports the comparison of photoreceptor output signals. R1-R6 photoreceptors send their axons from the retina to the first optic neuropil, called the lamina. R1-R6 photoreceptors, that see the same point in space, form synaptic connections with the same postsynaptic targets in the lamina. Some of these postsynaptic targets, in turn , send their processes to synapse with neurons in specific layers of the 2nd optic neuropil, the medulla. R7 and R8 cells also send their axons to synapse within these distinct layers in the medulla. Thus, the medulla has the anatomical organization necessary for the comparison of photoreceptor output, and perhaps color vision.
Figure
1-Adapted from Wernet et al. Homothorax Switches Function
of Drosophila
Photoreceptors from Color to Polarized Light Sensors. A) Ommatidial
subtypes
in the Drosophila eye:
each
ommatidium contains 8 photoreceptor cells, R1 - R8. (B) Ommatidia fall
into three categories based on opsin expression: 1) pale ommatidia
contain
R1-R6 which express Rh1, R7 which express Rh3, and R8 which express Rh5
2) yellow ommatidia contain R1-R6, which express Rh1, R7, which express
Rh4, and R8, which express Rh6. 3) ommatidia along the dorsal rim
contain
R1-R6 which express Rh1, R7 which express Rh3 and R8, which also
express
Rh3 (only pale and yellow are shown).
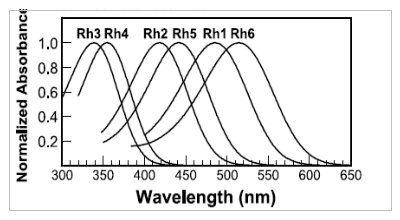
Figure
2-Adapted from Salcedo et al., Blue- and Green-Absorbing Visual
Pigments of Drosophila:
Expression and Physiological Characterization of the R8 Photoreceptor
Cell-Specific
Rh5 and Rh6 Rhodopsins. This nomogram shows the calculated rhodopsin
absorption
curves for Rh1-Rh6 based on the R-form curve fits to
microspectrophotometry
and detergent-extracted pigment data. (Please note- these data will NOT
be used in our calibration calculations, as they do not accurately
represent
the spectral sensitivities of the photoreceptors in vivo.) Rh2 is only
expressed in primitive light sensors on the dorsal part of the fly head
and will not be considered in this paper.
Further physiological and behavioral analysis must
performed
order to formally address whether color vision exists in Drosophila.
In order to do this, I plan to characterize wild-type behavior in
response
to various color stimuli presented on a CRT monitor. Once wild type
behavior
has been well described I can then perform an enhancer trap screen
(described
in the Genetics appendix III) to dissect the neural circuits involved
in Drosophila
color vision.
Background: Calibration of an Iiyama HM204DTA 22’’ CRT monitor
In order to calibrate the monitor for use in fly behavior experiments we must first find the relationship between the digital value we enter in the computer’s software and the intensity emitted by each of the phosphors. This relationship is non-linear, and is called the gamma function. The gamma function will allow us to precisely display any intensity of phosphor using our software.
Using the gamma functions we will then verify that the phosphors are independent from each other. Phosphor independence means that the intensity of one phosphor should not be affected by the intensities of any of the other phosphors. According to Wandell (FOV 1995), the property of phosphor independence fails when the monitor’s power supply cannot meet the demands of all three electron guns.
Lastly, we will determine the calibration matrix
that
relates the monitor’s phosphor intensities to the Drosophila
photopigment absorption rates. The calibration matrix will allow us to
precisely control the relative absorption rates of each of the Drosophila
photoreceptors that respond to light in the visible range. We can then
create stimuli that only affect one type of photoreceptor. Since there
are no monitors that currently display light in the UV range, we will
not
be able to address color visual behavior that utilizes these
wavelengths.
Equipment
PR650
Spectrophotometer:
The PR650 measures the power spectral density of what
is in it’s field of focus and any illumination present, so all
calibration
experiments must be performed in the absense of any light source other
than the monitor of interest.
Methods & Results
In
order to meaningfully characterize the fly visual system, it is
necessary
to create stimuli that can manipulate the cones of the flies in very
precise
and accurate ways. Therefore, we must calibrate the CRT monitor that
will
generate the stimuli for the color vision experiments. The calibrations
that are of the most importance are the determination of the gamma
function,
testing the phosphor independence, and creating a calibration matrix to
convert between the flies’ cone sensitivities and the RGB values of the
monitor phosphors. For initial calibration measurements, the stimulus
will
be a solid square.
Gamma Function
The gamma function describes the relationship
between
the digital value and the output intensity of the monitor. To
characterize
this relationship, we measured the output intensity for 256 equally
spaced
digital values. For each digital value, we used the PR650 to measure
the
power spectral density (PSD) of the monitor. We then calculated the
intensity
by integrating the PSD. The shape of the intensity vs. digital value
plot
is similar to a power curve, as shown in Figure 3. We
approximated
the gamma function to be a simple power function:
I = DVg
We chose the gamma value that minimizes the difference
between the measured intensity and the power function. Although we
expected
the gamma functions of the three phosphors to be similar, we determined
the gamma function for each phosphor separately.
Figure 3: Measured Gamma Curves
The gamma values are approximately:
Knowing the gamma value for each phosphor, we can create a gamma function and an inverse gamma function. The gamma function is I = DVg and the inverse gamma function is DV = I1/g allowing us to convert between the desired output intensity and the digital value needed to produce that intensity.
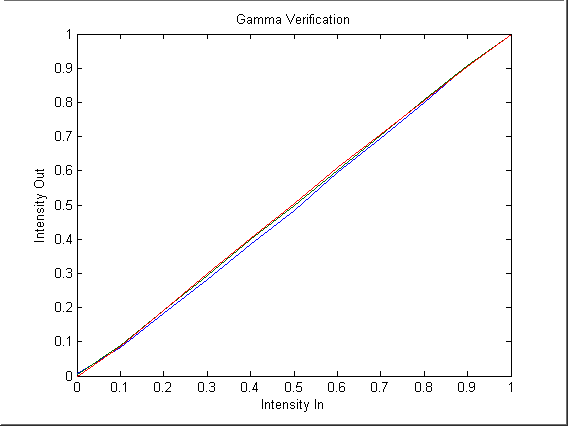
To
verify the gamma values, we converted desired intensity values and
converted
them to digital values using the inverse gamma function. We measured
the
PSD of the displayed images. We then compared the calculated intensity
to the desired intensity. As shown in Figure 4, the output intensity
closely
follows the input intensity. Therefore, we have sufficiently
described
the gamma function.
Figure 4: Gamma Function Verification
Phosphor Independence
To ensure that we can independently control the three monitor phosphors, we must verify phosphor independence. We converted the relative intensities 0.2, 0.6, and 1.0 to the corresponding digital value for each of the three phosphors using the inverse gamma function. Then, we displayed the 27 combinations of RGB phosphors at those intensities. We measured the PSD for each combination and calculated the output intensity. Using least-squares approximation, we found the approximate rgb values for the displayed colors based on the maximum output of each phosphor. Figure 5 shows the relative error between the rgb values used to display the image and the estimated rgb values that would produce the measured output spectrum.
Figure 5: Phosphor Independence
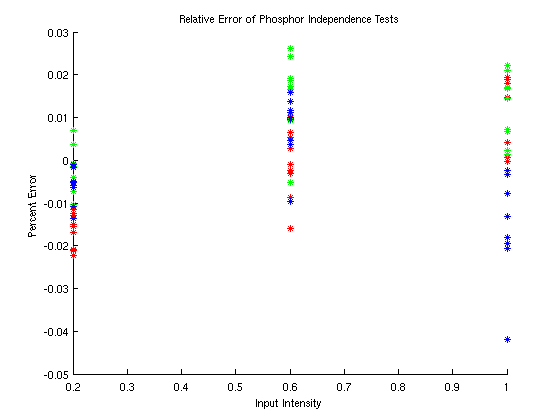
The error between the input rgb values and the
estimated
rgb values is fairly small. The error for all combinations is
less
than about 4% and all but one combination have an error less than
3%.
For initial tests, this is satisfactorily independent.
Calibration Matrix
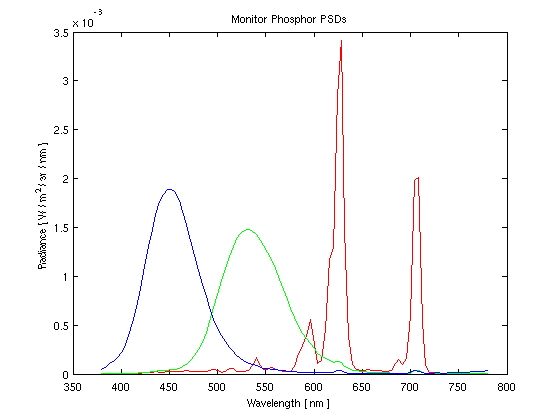
Finally, we would like to be able to convert the rgb values of the monitor to the cone sensitivities of the Drosophila. By multiplying the matrix of the spectral sensitivities of the flies' cones (graphically shown in Figure 6) and the matrix containing the maximum PSD for the monitor phosphors (shown in Figure 7), we can create a 3x3 calibration matrix. When the calibration matrix is multiplied by rgb values, the output will be the resulting cone response of the flies. When the inverse of the calibration matrix is multiplied by the desired cone response of the flies, the result will be the rgb values necessary to elicit that response.
Figure 6 shows the experimentally determined responses of the Drosphila.
Figure 6: Normalized Cone Sensitivities
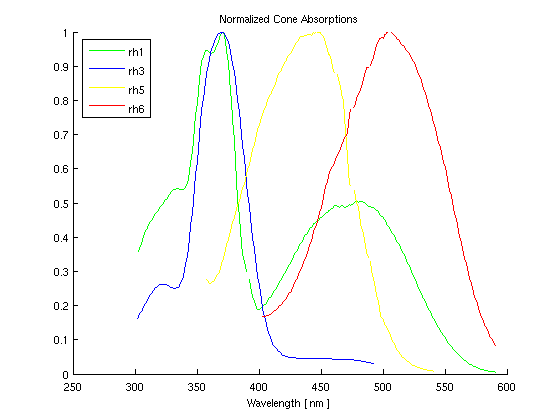
Figure 7 shows the experimentally measured maximum phosphor responses of the CRT Monitor.
Figure 7: Maximum Phosphor Outputs
This matrix was created using data that was scaled
in
an unspecified way. While it is possible that the data is correct
as it was presented to us, it is also quite likely that the scaling of
the data has interfered with the physical meaning of the numbers.
Once we have access to the raw data, we can easily recalculate the
calibration
matrix. Also, a few data points were missing, so we set the
missing
values to zero, even though we know this is not correct.
Hopefully,
the raw data will be a complete set. This matrix also does not
represent
the complete set of fly data because the PR650 only returns the data
every
4nm. We had to ignore much of the fly sensitivity data, which was
measured at 1nm intervals.
The 3x3 matrix for converting rgb to fly cone responses
is created as follows:
RGBtoFLY = FlyData * Monitor,
where
FlyData
is a fat matrix and Monitor is a skinny matrix
RGBtoFLY =
0.0004
0.0065
0.0135
0.0003
0.0020
0.0240
0.0011
0.0199
0.0177
Conclusion
We successfully evaluated the gamma function and
phosphor
independence. Although there was some error in our estimation of
the gamma values and the phosphor independence test, the errors are
small
enough for the experiments being performed. The calibration
matrix
is a very rough estimate because we used very approximate data.
However,
we have demonstrated the process for calculating the calibration matrix
and once we have the appropriate data, recalulation will be trivial.
Future Work
For a full characterization of the monitor, we will perform several additional tests including spatial independence, and consisitency over time and stimuli. For this project, we measured the PSD at the center of the monitor. To ensure the flies will be exposed to the same stimulus regardless of their position on the monitor, we will measure the PSD at various positions across the monitor. We will then evaluate the consistency of the intensity over space.
Similarly, we want to ensure that the perfomance from test to test does not change significantly so that the results from separate experiments can be meaningfully compared. To evaluate the consistency over time, we will compare intensity data collected over an extended period of time. If we find that the monitor is not sufficiently consistent over time, it will be necessary to recalibrate periodically.
Eventually, the experiments will involve non-uniform stimuli. We will need to evaluate the monitor's ability to display spatial frequencies. We will evaluate the independence of striped stimuli as a function of spatial frequency. We expect to find a frequency at which the PSD of a stripe will be affected by the neighboring stripes. This will provide a limit to the frequency of stiumuli that can be used in experiments.
At this time we can neither measure power at
ultraviolet
wavelengths with the PR650 nor control the output of the CRT monitor at
those wavelengths. Since Drosophila are sensitive to
ultraviolet
wavelengths, it would be of interest to evaluate methods of measuring
and
controling ultraviolet stimuli so the Drosophila visual system
can
be further characterized.
Appendices
Appendix
I: Additional Files
Matlab Code: Calibration.m
PowerPoint Presentation: ColorCalibTalk.pps
Appendix II: References
Heisenberg M and Buchner E. The Role of Retinula Cell Types in Visual Behavior of Drosophila melanogaster. Journal of Comparative Physiology. 117, 163-182 (1977).
Menne D and Spatz HC. Colour vision Drosophila melanogaster. Journal of Comparative Physiology. 114, 301-312 (1976).
O’Tousa, JE, Baehr W, Martin RL, Hirsh J, Pak WL, Applebury ML. The Drosophila ninaE gene encodes an opsin. Cell. 40, 839-850 (1985).
Salcedo E, Huber A, Henrich S, Chadwell L, Chou WH, Paulsen R, Britt SG. Blue and green absorbing visual pigments of Drosophila: ectopic expression and physiological characterization of the R8 photoreceptor cell-specific Rh5 and Rh6 rhodopsins. Journal of Neuroscience. 19, 10716-10726 (1999).
Schumperli RA. Evidence for colour vision in Drosophila melanogaster through spontaneous phototactic choice behavior. Journal of Comparative Physiology. 86, 77-94 (1973).
Tang S and Guo A. Choice behavior of Drosophila facing contradictory visual cues. 294, 1543-1547. 2001.
Wandell BA. Foundations of Vision. Sinauer Associates Inc. 1995.
Wernet MF, Labhart T, Baumann F, Mazzoni EO, Pichaud F, Desplan C. Homothorax switches function of Drosophila photoreceptors from color to polarized light sensors. Cell. 115, 267-79. 2003.
Zuker C, Montell C, Jones K, Laverty T, Rubin G. A
rhodopsin
gene expressed in photoreceptor cell R7 of the Drosophila
eye: homologies with other signal-transducing molecules. Journal of
Neuroscience.
7, 1550-1557 (1987).
Appendix III: Genetics
Many
years of studying and manipulating the Drosophila
genome have resulted in a plethora of genetic tools that are very handy
in a variety of fields. In my project I will make use of an enhancer
trap
method that will be used to screen for flies with a specific defect in
color vision. The basic idea behind an enhancer trap screen is to drive
the expression of a gene that encodes a temperature sensitive neuronal
silencer (or GFP for neuron imaging) in subsets of neurons. These
genetically
manipulated flies can then be assessed for color-specific behavioral
defects.
This neuronal silencer gene is driven in random subsets of neurons by
coupling
it’s expression to enhancer elements within the genome (Fig 8).
Appendix IV: Work description
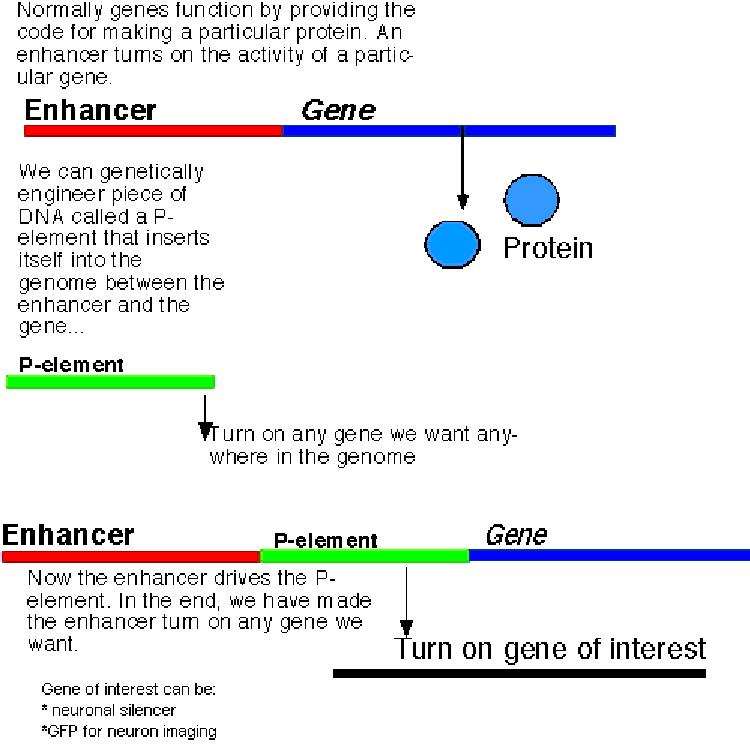
Figure 8: Enhancer-trap explanation