|
|
|
|
Experiments
|
|
|
|
|
|
|
|
|
|
|
|
|
|
|
|
|
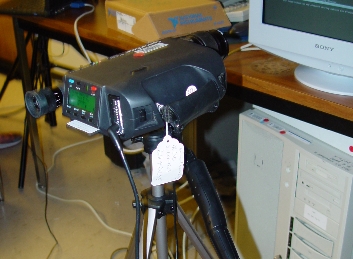
A spectrometer "SpectraScan® PR 650" like the one in the figure was used to measure the spectral response of the different screens under a computer stimulus.
The stimuls, generated in Matlab, consisted in a set of full-screen solid-color images with RGB parameters ranging from [1,1,1] to [0,0,0], [1,0,0] to [0,0,0], [0,1,0] to [0,0,0], and [0,0,1] to [0,0,0] with steps of 0.05.
These stimulus should be a good starting point, supposing a reasonably linear system behaviour of the screens.
|
The screens tested were:
IBM® Thinkpad® LCD laptop display
Dell® Latitude® LCD laptop display
HP® CRT display
Sony® Trinitron® CRT display
Panasonic® Plasma TV
With the obtained spectral power distributions, the students did the following:
- Compare the SPDs of the different intensities.
- Check the interaction of the primaries, comparing the white light with the monochromatic stimulus.
- Check the linearity of the screen primaries by normalizing the different intensities results.
|
|
|
|
Data processing
|
|
|
|
|
|
|
|
|
|
|
|
|
|
In order to obtain more information, the students processed the spectral power density results obtained using the spectrometer.
That way they obtained the XYZ values corresponding to the different intensity stimulus using the vision science principle:
With this data they obtained the gamma curves, plotting the luminance value versus the intensity digital input.
|
|