Stereo Results
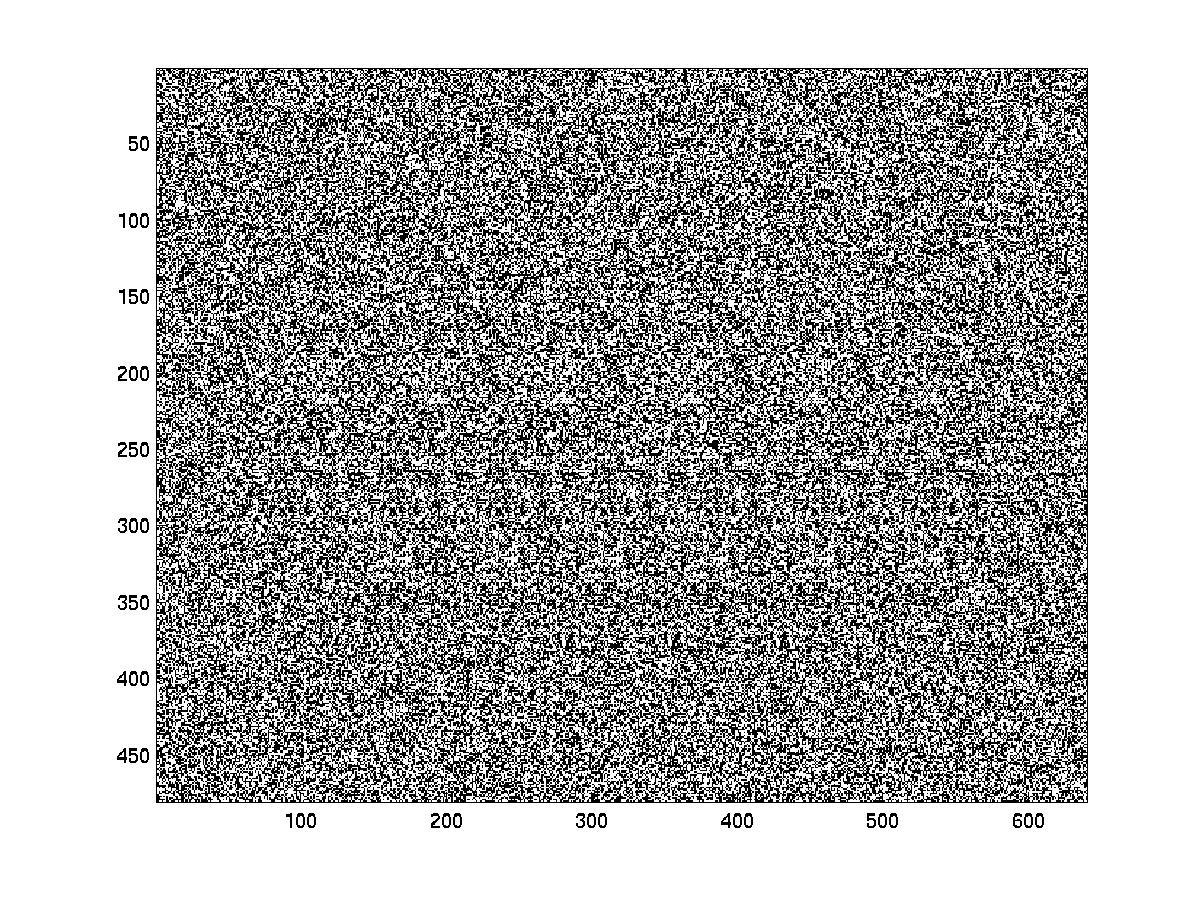
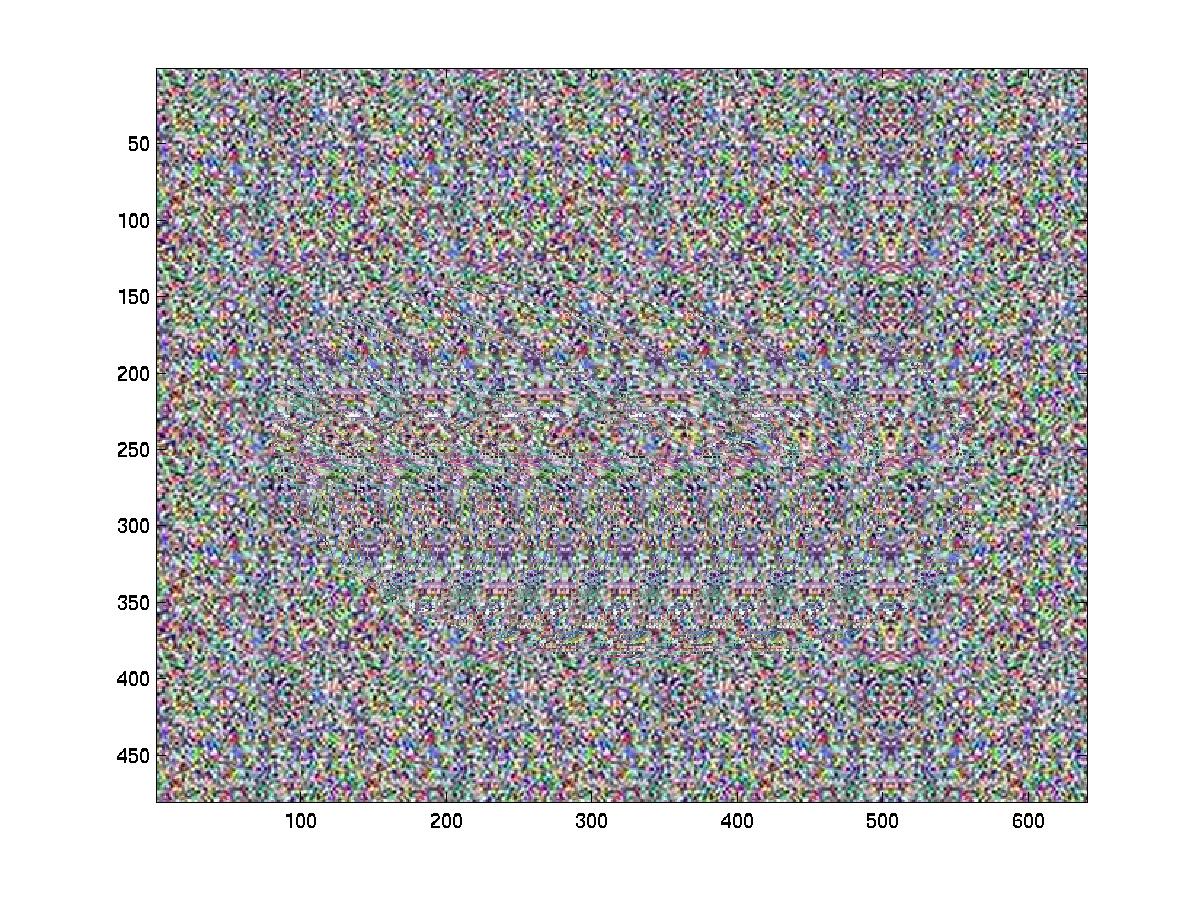
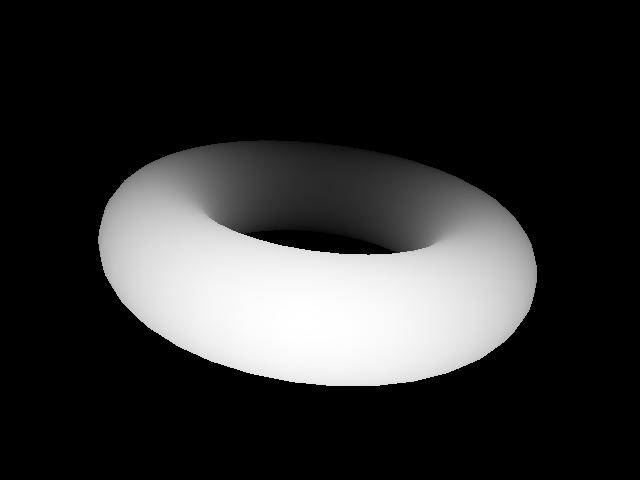
After implementation of our code, we were able to obtain a few depth maps of simple geometric figures. The following displays the results for a torus. The one without color is the random dot stereogram, while the color images represent the patterned stereograms.
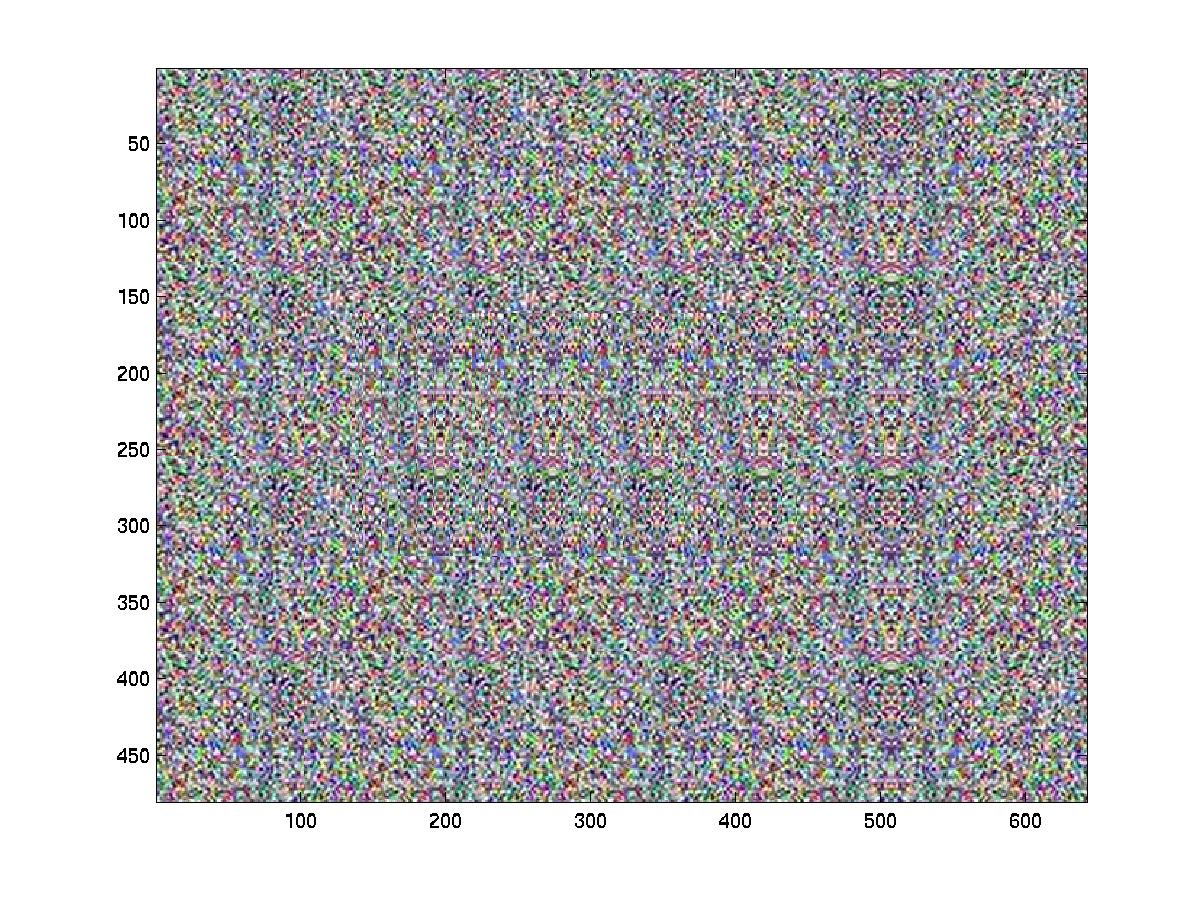
Can you see what I see? Having trouble seeing the image? Try the one below.
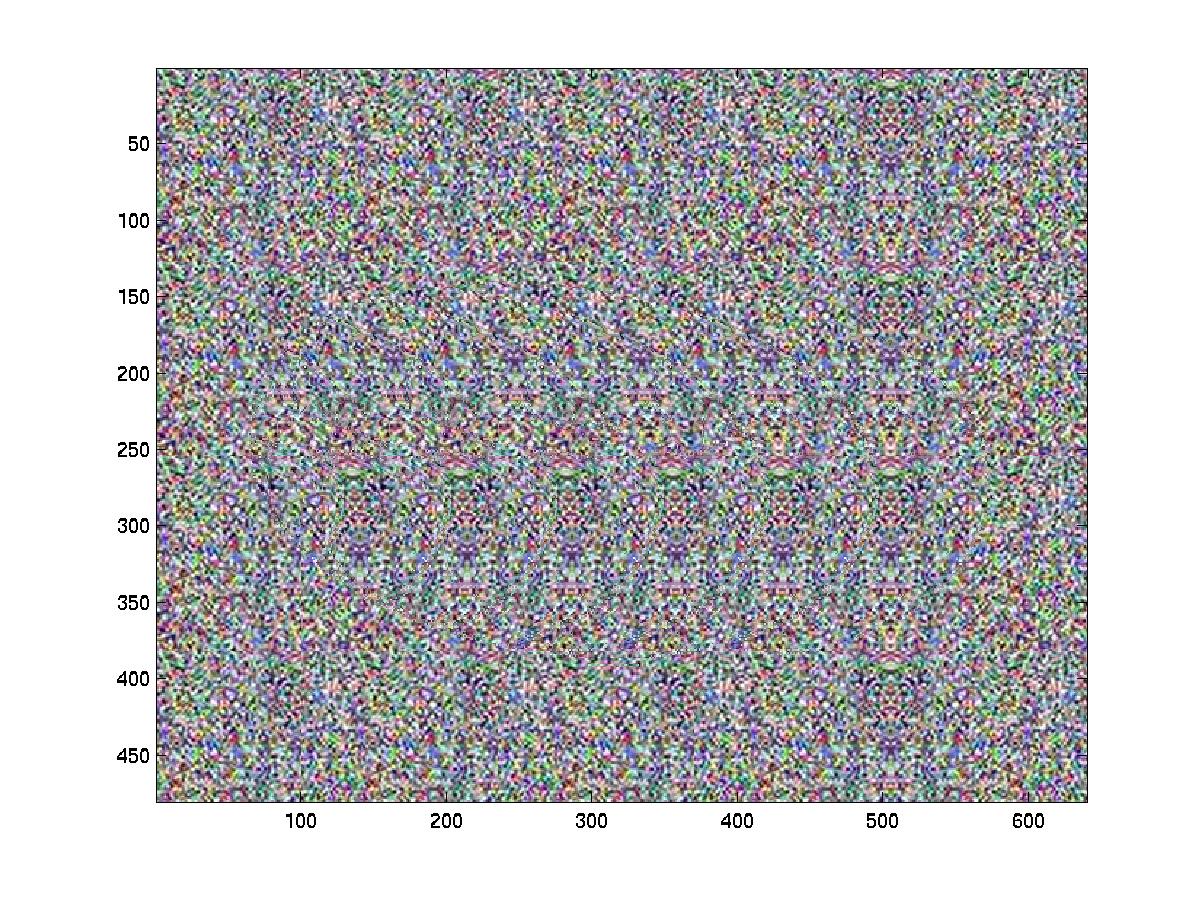
From the two images above, it should be apparent that the patterned image is much easier to view than the random dot stereogram. This is due to the color that is inherent in the pattern design. The two above images are for m=1/3, which corresponds to the depth of image. The following few images vary the value of it from 0.1 to 0.7, the images are more difficult to perceive since our eyes do not converge as well at higher depths.

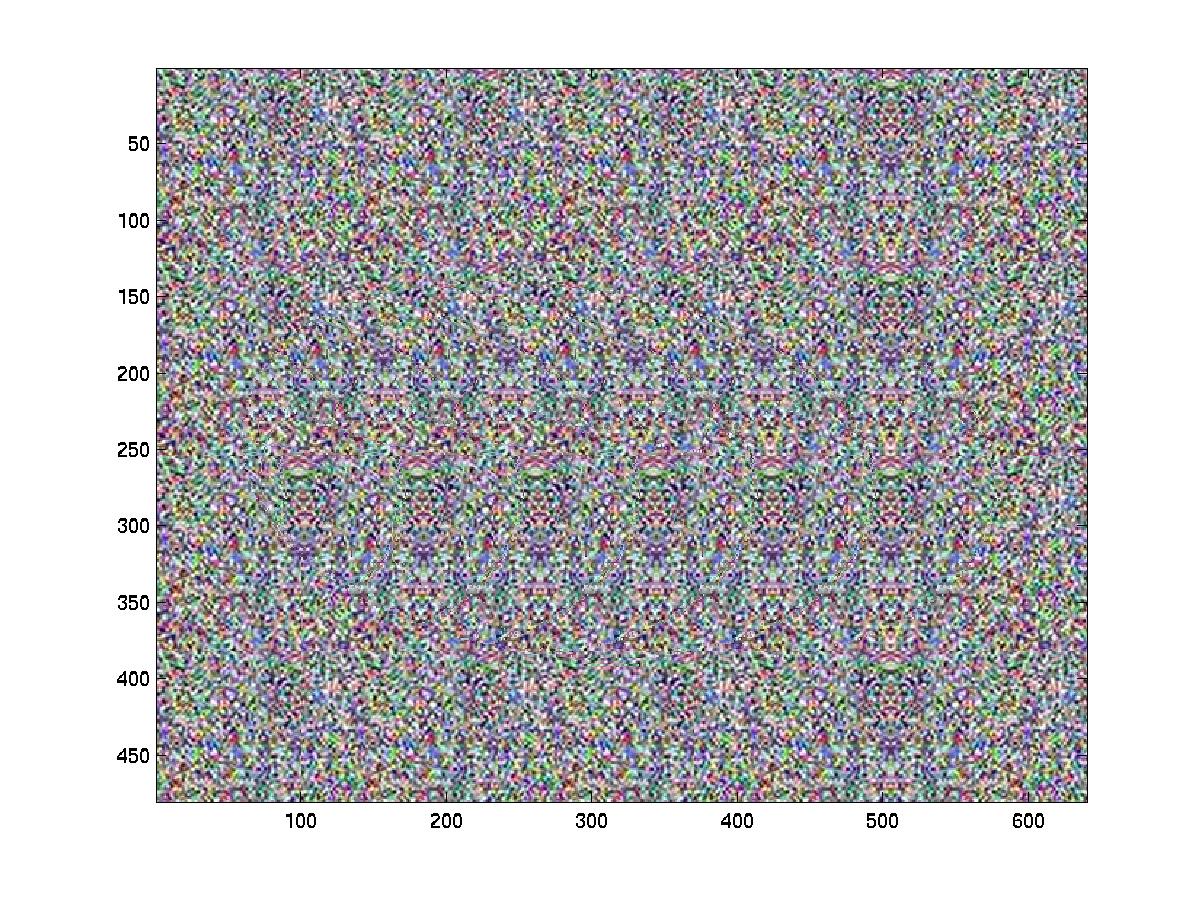
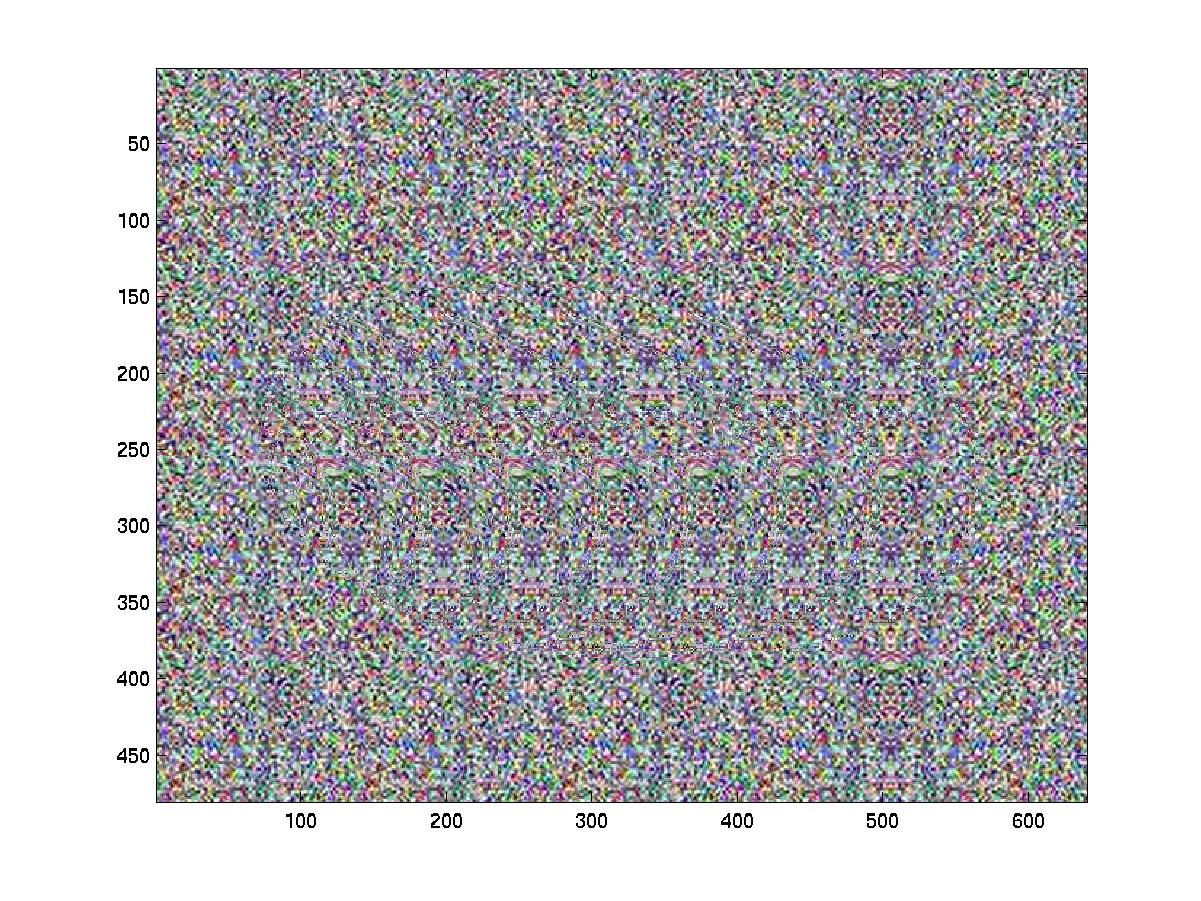
Going from upper left (m=0.1) counter clockwise (m=0.2), (m=0.5), and (m=0.7)
The following image is what should jump out to the viewer.
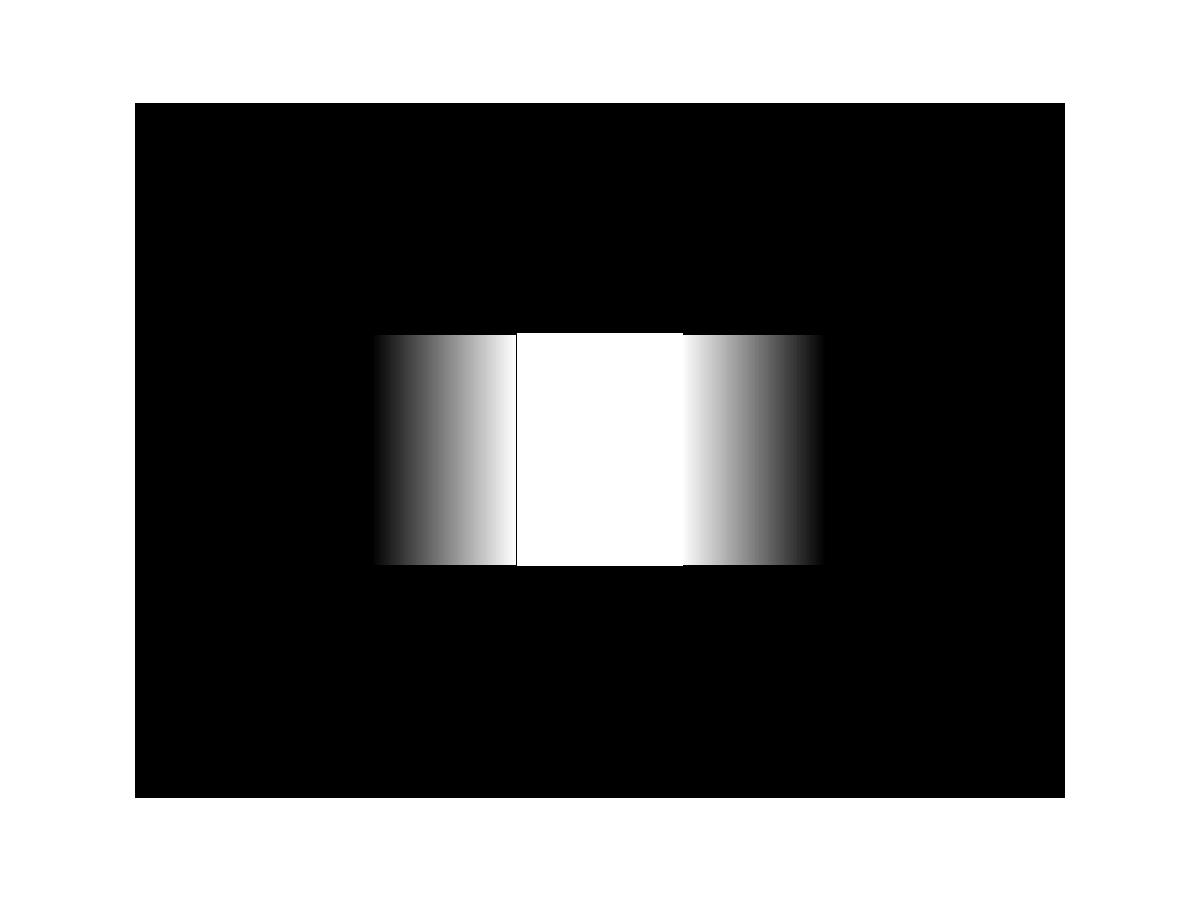
The following is a depth map of a simple rectangular figure that we created.
Matlab Code to create all the above images
![]()
![]()