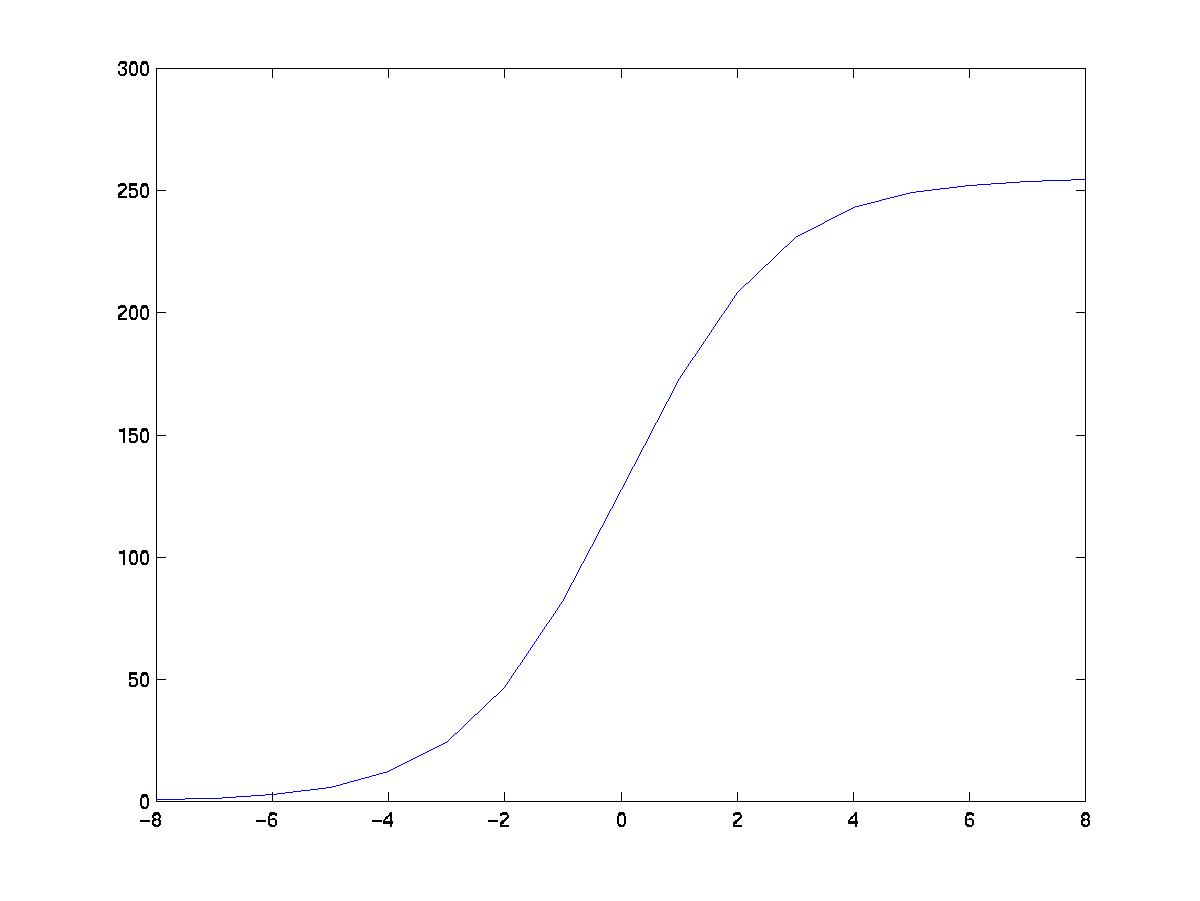
Fig 1. Curve of pixel intensity variation with photographic film
Once the visually significant regions have been identified, any suitable graylevel transformation based on these regions can be used for image enhancement.
We use three different techniques for enhancement, which moves the visually important regions to midtones to provide the best detail. At the same time, the tonal variations in extreme dark or light tones which typically occur in the dull or unimportant regions are kept small.
The following graphs are the pixel intensity values which vary with exposure density.
I) Photographic film curve
Fig 1. Curve of pixel intensity variation with photographic film
II) Linear curve based on linear values obtained using the digital camera
To obtain values for the digital camera, a uniformly gray image is taken with the digital camera at different exposure levels. The camera we used allowed us to vary the exposure levels between -2 and 2. The images taken are uploaded and the average pixel intensity at each exposure level is calculated. The graph below is obtained from these average values, and extrapolated. However, since pixel intensities vary between 0 and 255, at exposure levels below the cutoff, the pixel intensity is set to 0, and likewise for the upper cutoff value at 255.
III) Best Fit exponential curve based on linear values obtained using the digital camera
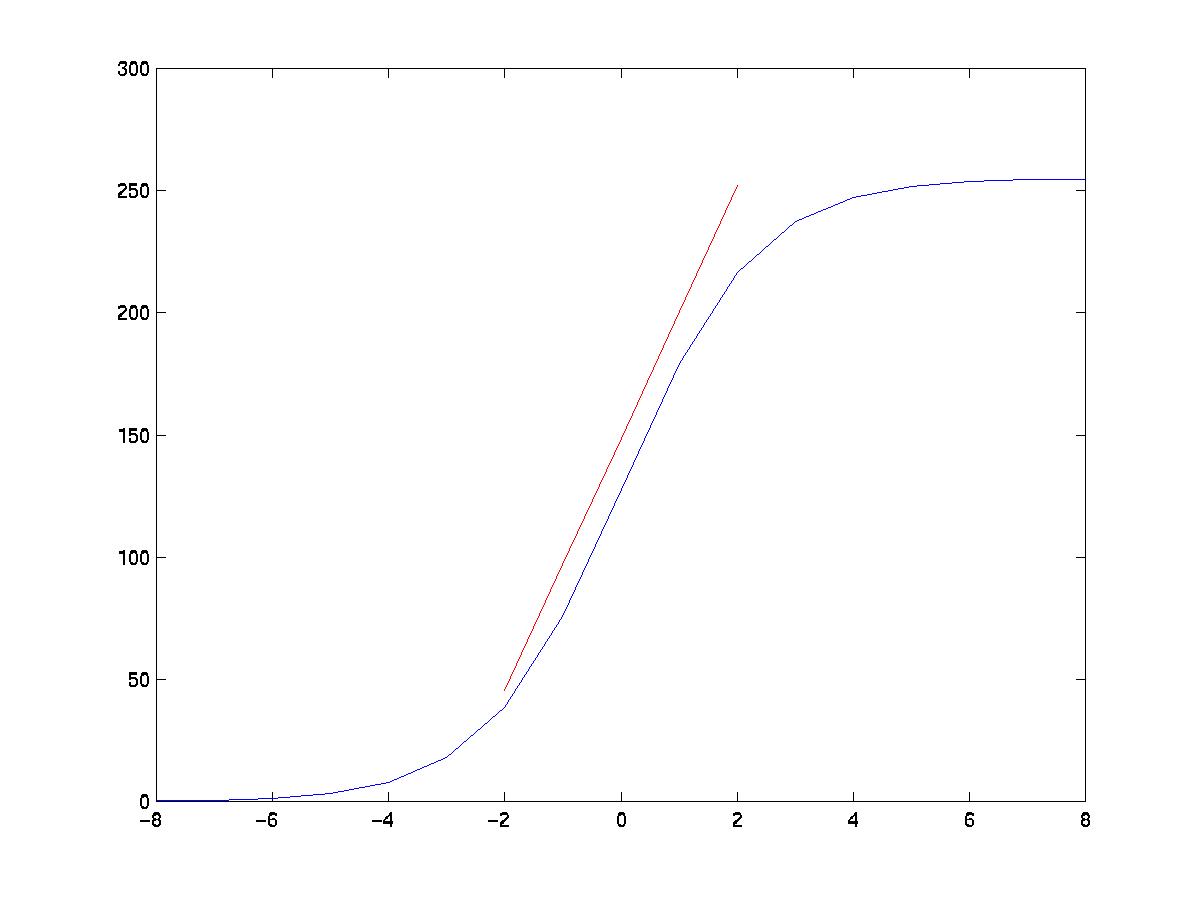
Fig 2. Best fit exponential curve of pixel intensity variation with digital camera, compared to the linear curve obtained
The resulting pictures from the above 2 techniques clearly demonstrate
the strength of the 1st technique. Hence a modified 3rd technique is used.
This technique involves matching the linear region of the digital camera
by fitting an exponential curve. An exponential curve is preferred since
slight variations in exposure at the extreme levels should have little,
but still some, effect on the pixel intensity. The curve we obtained has
an equation as above, with the c value around 0.86.
Operations using Curves
Two basic operations are performed:
The 2nd function can be used to expose a pixel with intensity p1 by dx.
Global Enhancement
To enhance a poorly-exposed image globally, the procedures are:
1) Identify the visually important segments in the image, i.e idnetify all the segments with V(S) > VT
2) Compute the average pixel intensity Pav of the visually important segments.
3) Find the exposure needed to push Pav to neutral gray (=128) for best detail. Let s = Stops(Pav, 128).
4) Expose every pixel in the image by s, ie perform the operation Push(p, s) where p is the pixel intensity.
In this way, the visually significant regions are pushed towards neutral gray to provide the best detail.