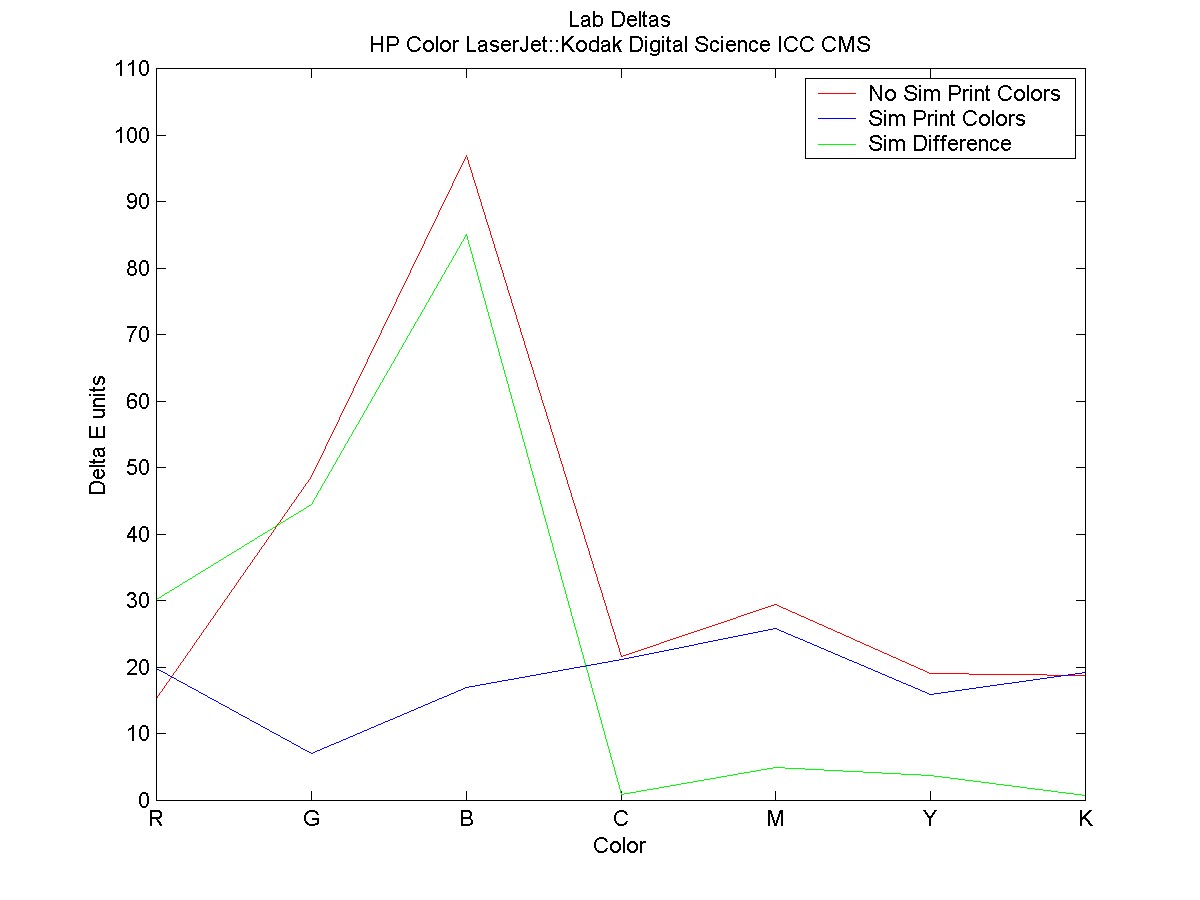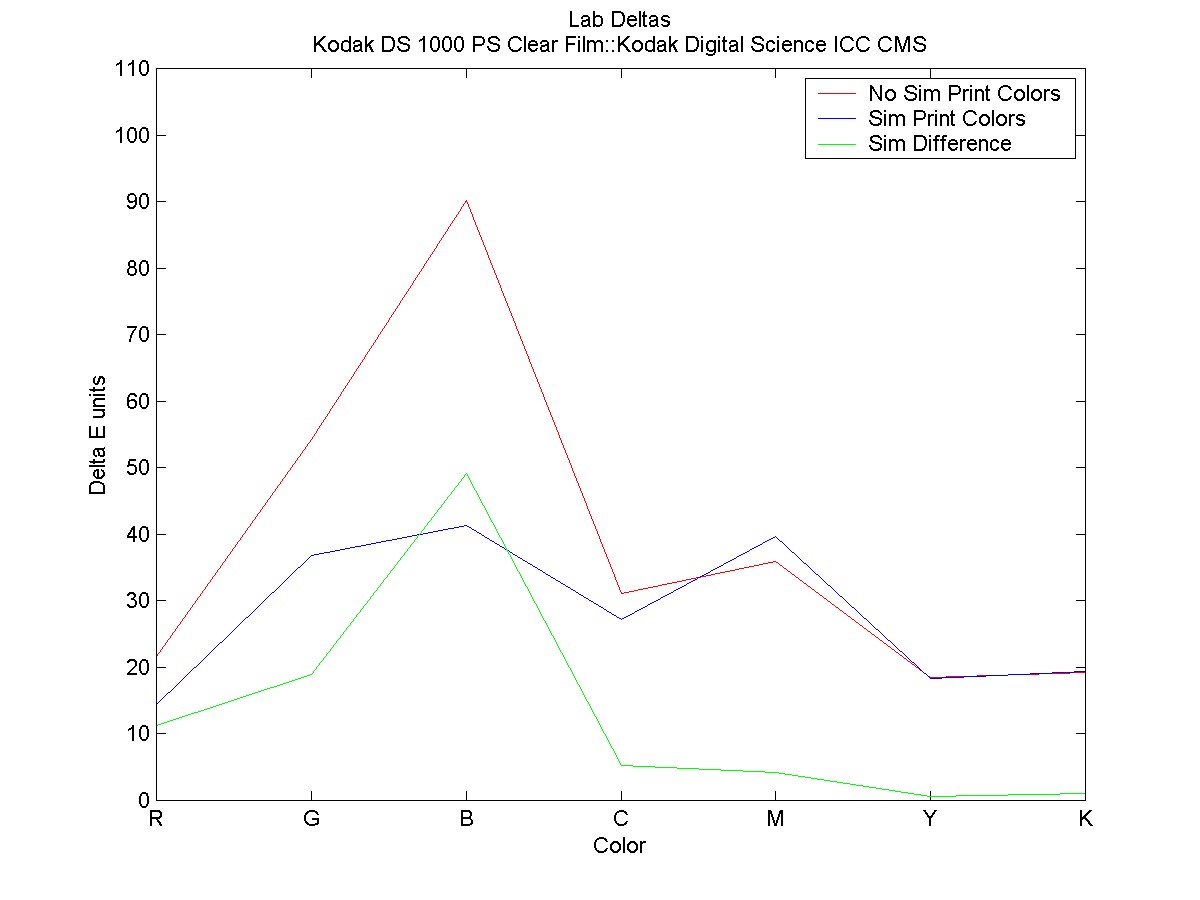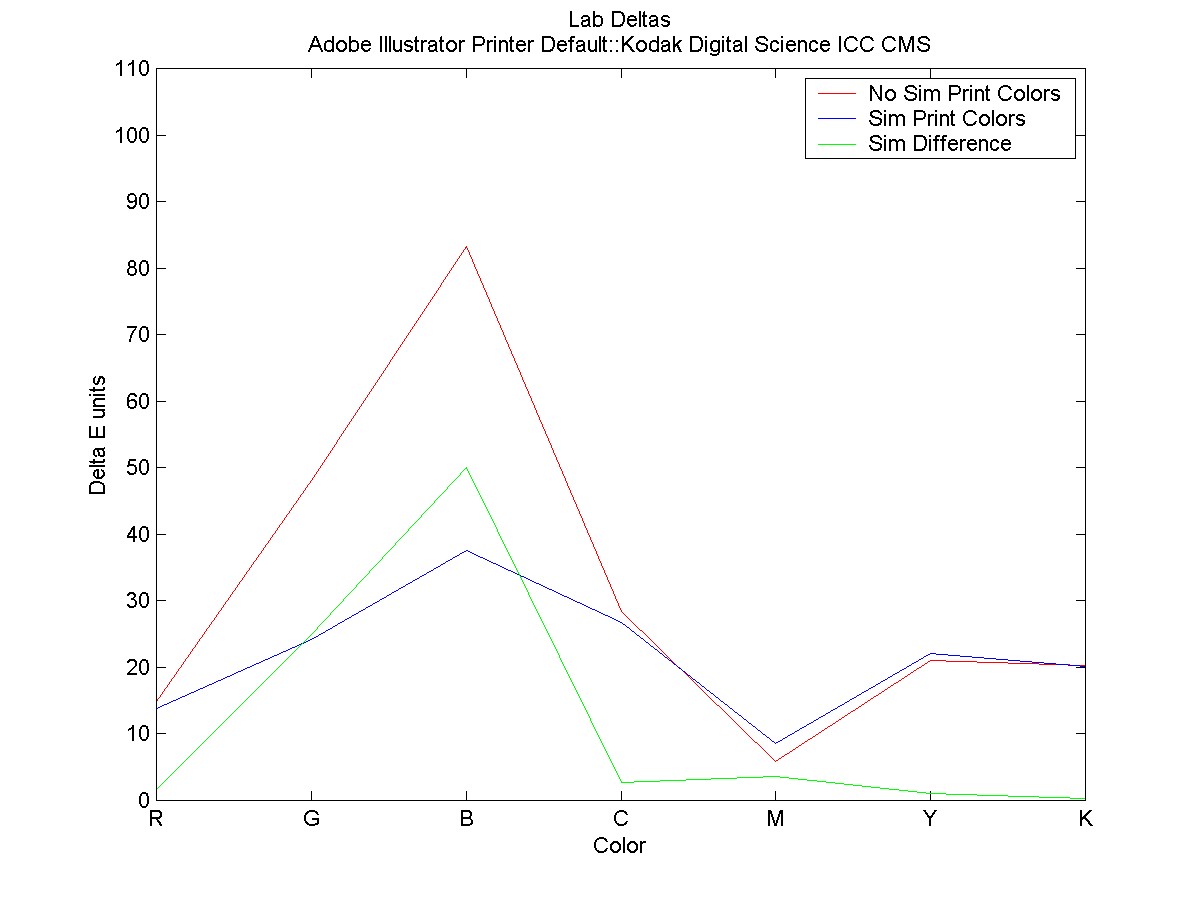
These plots depict the Euclidian distance between Lab values for each color for the Kodak Digital Science ICC CMS Engine.
The Green plot shows the difference between monitor color values with and without simulated printer colors.
The Red plot shows the difference between monitor color values without simulated printer colors and the measured color values of the associated printout.
The Blue plot shows the difference between monitor color values with
simulated printer colors and the measured color values of the associated
printout.