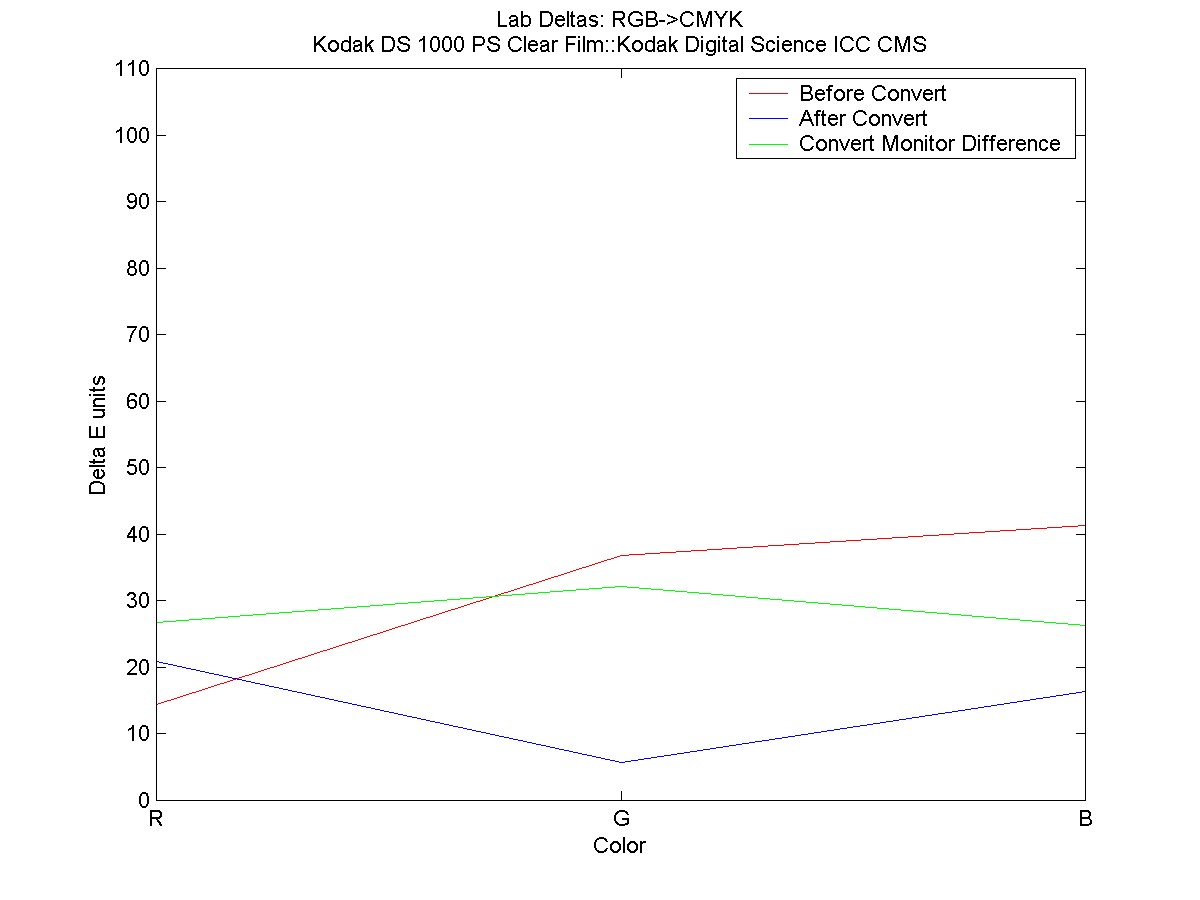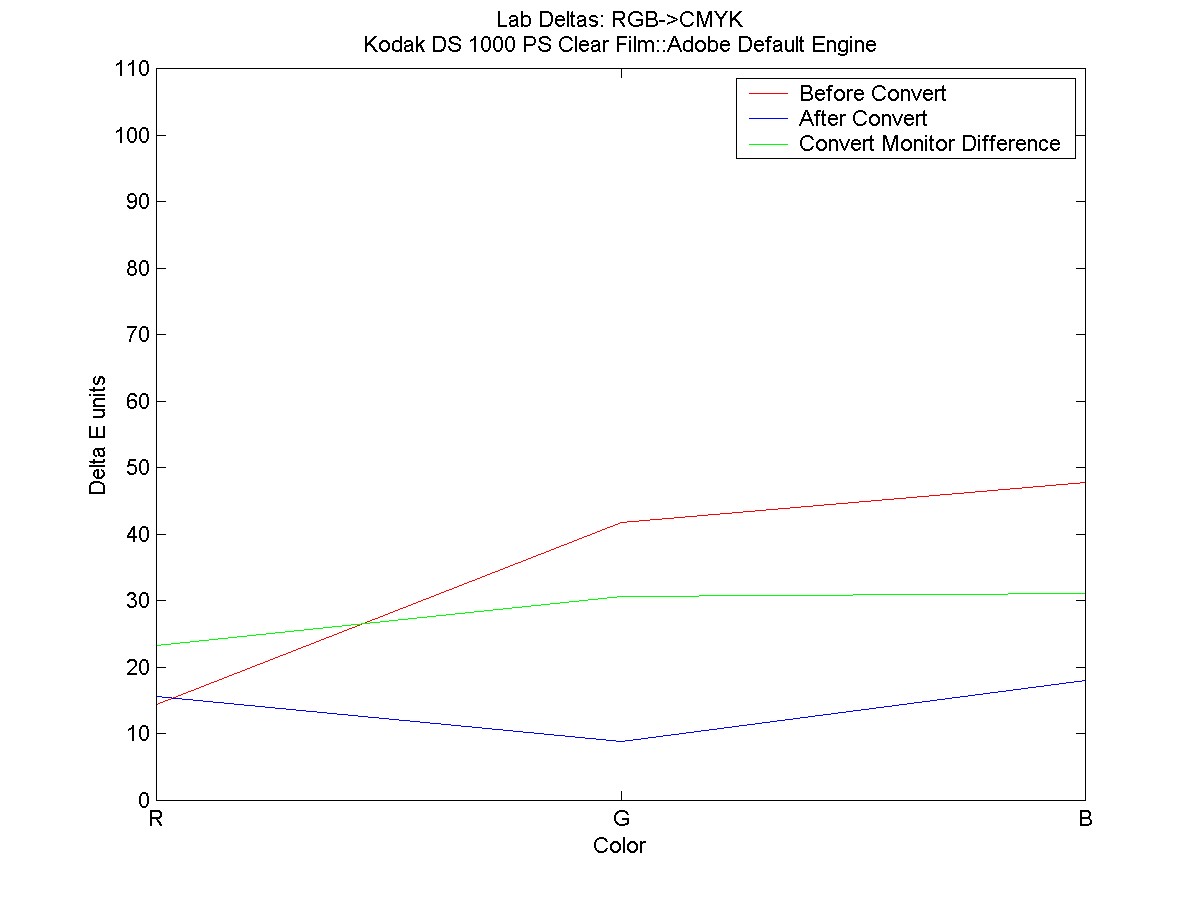
These plots depict the Euclidian distance between Lab values for each color .
The Green plot shows the difference between monitor color values before and after color conversion.
The Red plot shows the difference between monitor color values and the measured color values of the associated printout.
The Blue plot shows the difference between monitor color values after
conversion and the measured color values of the associated printout.