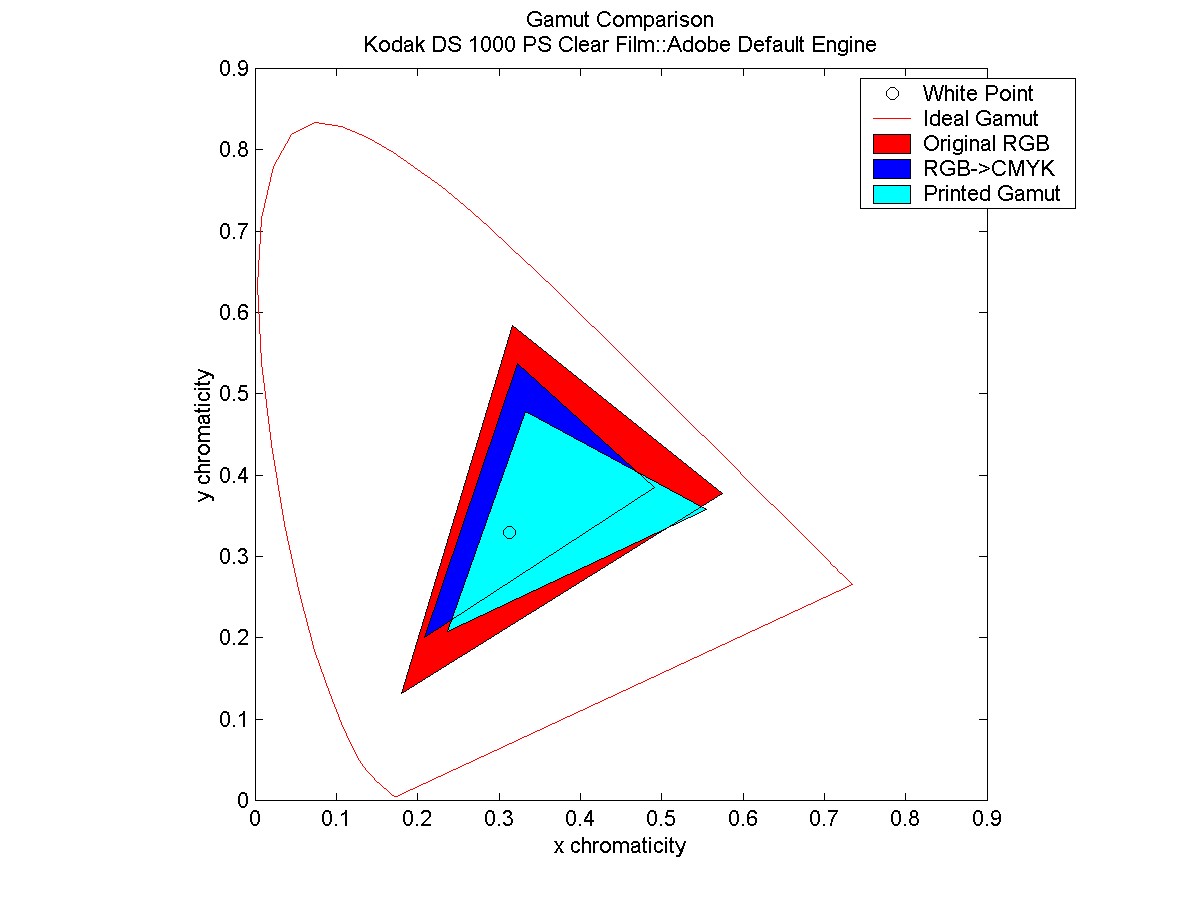
The first two plots depict the RGB gamuts measured on the computer
monitor before and after calling the function, 'Convert to CMYK' for both
Engines along with the gamut of the printout.
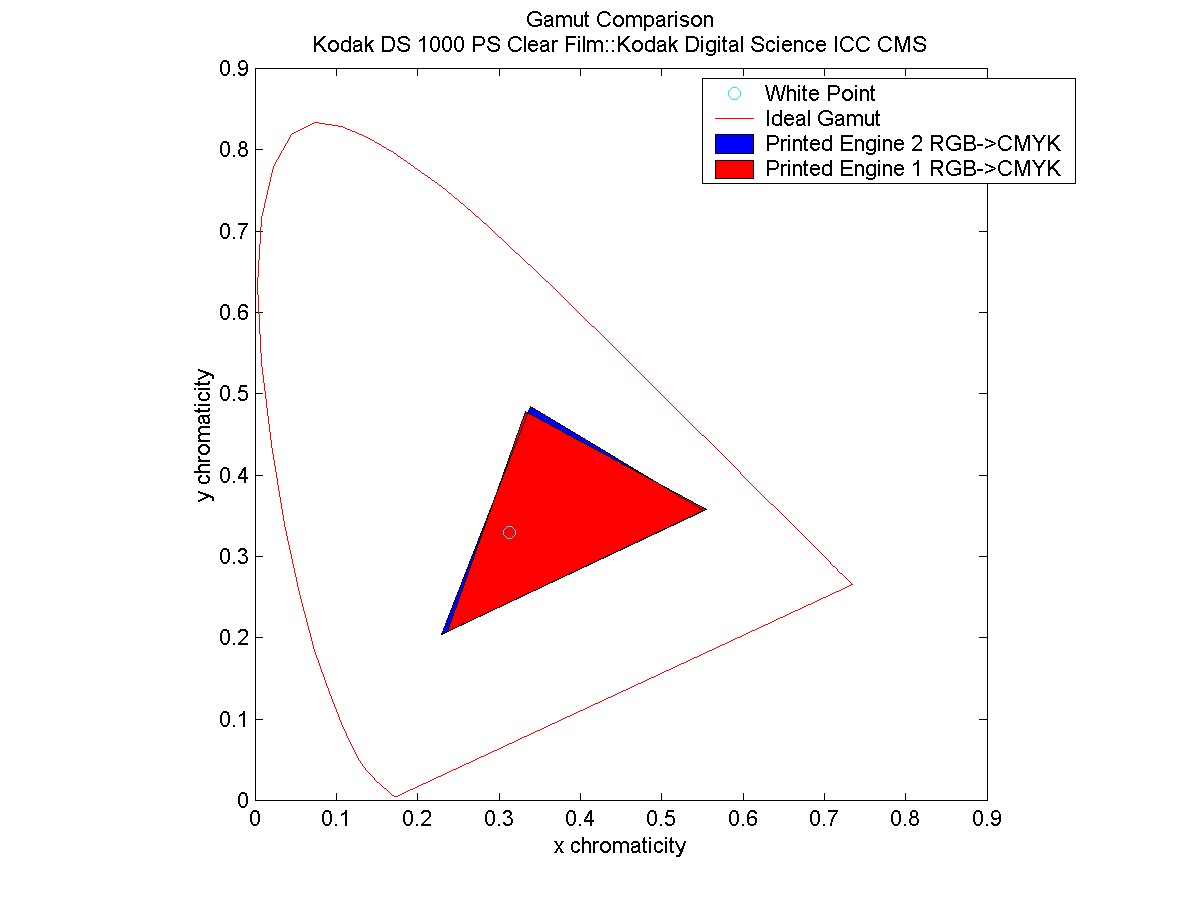
The third plot shows the slightly different effects each engine has
on the printout of this function.
The thin red line is our 'ideal gamut' associated with the full color
spectrum.