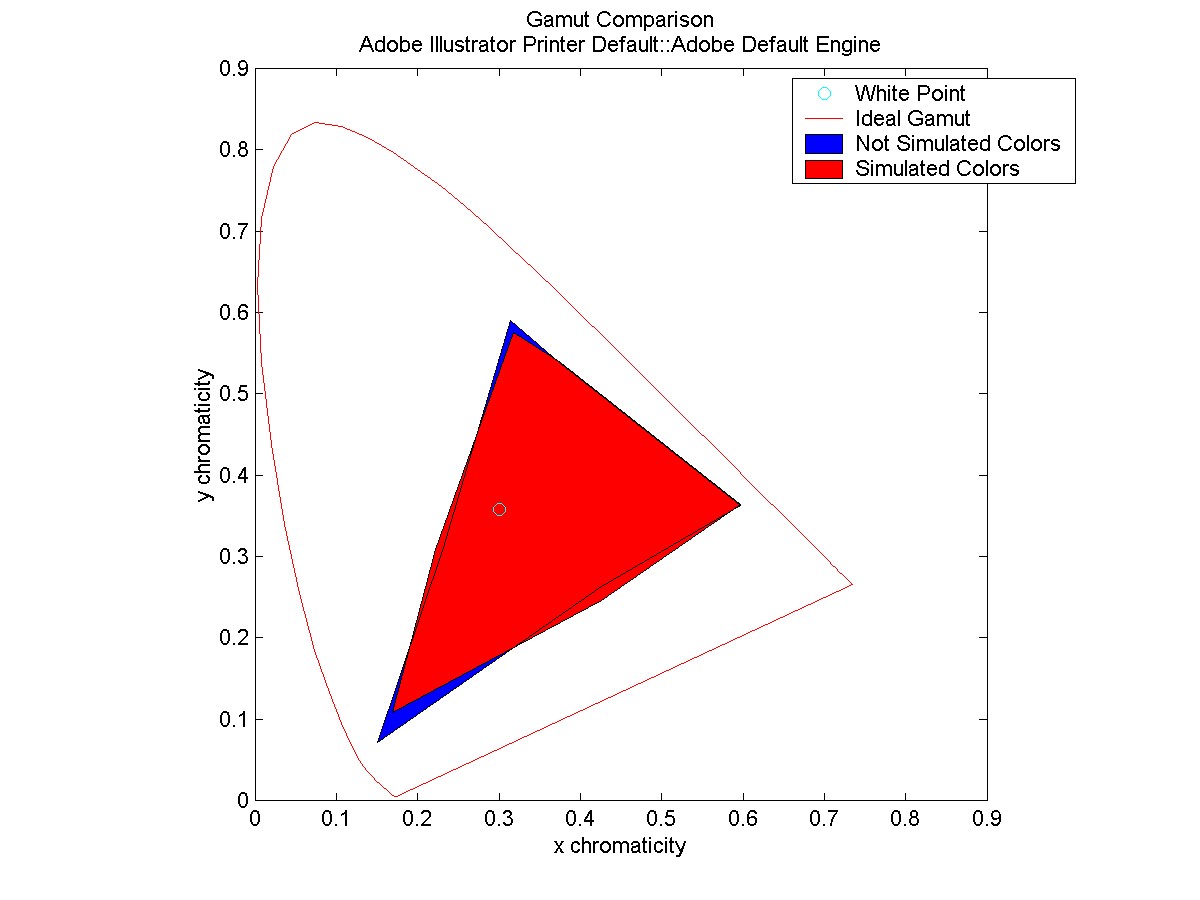
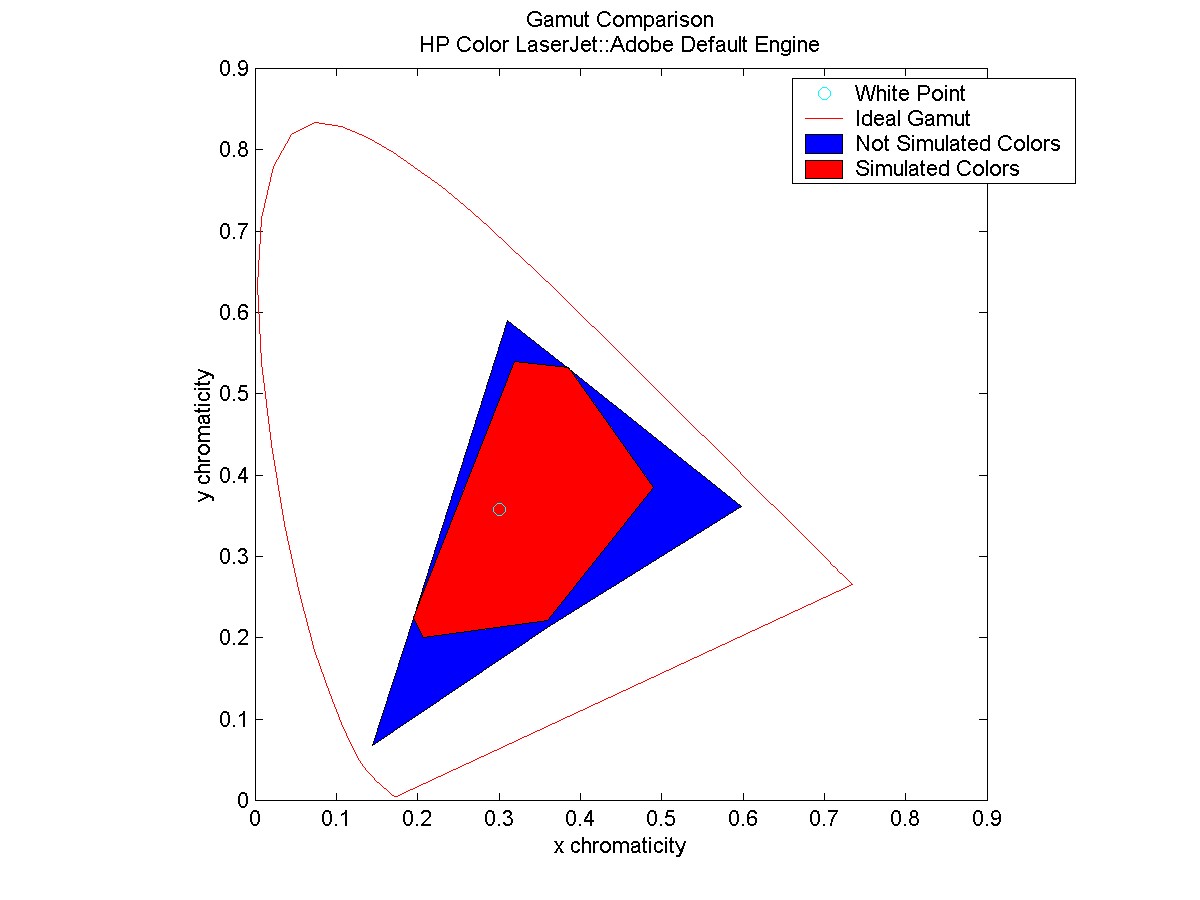
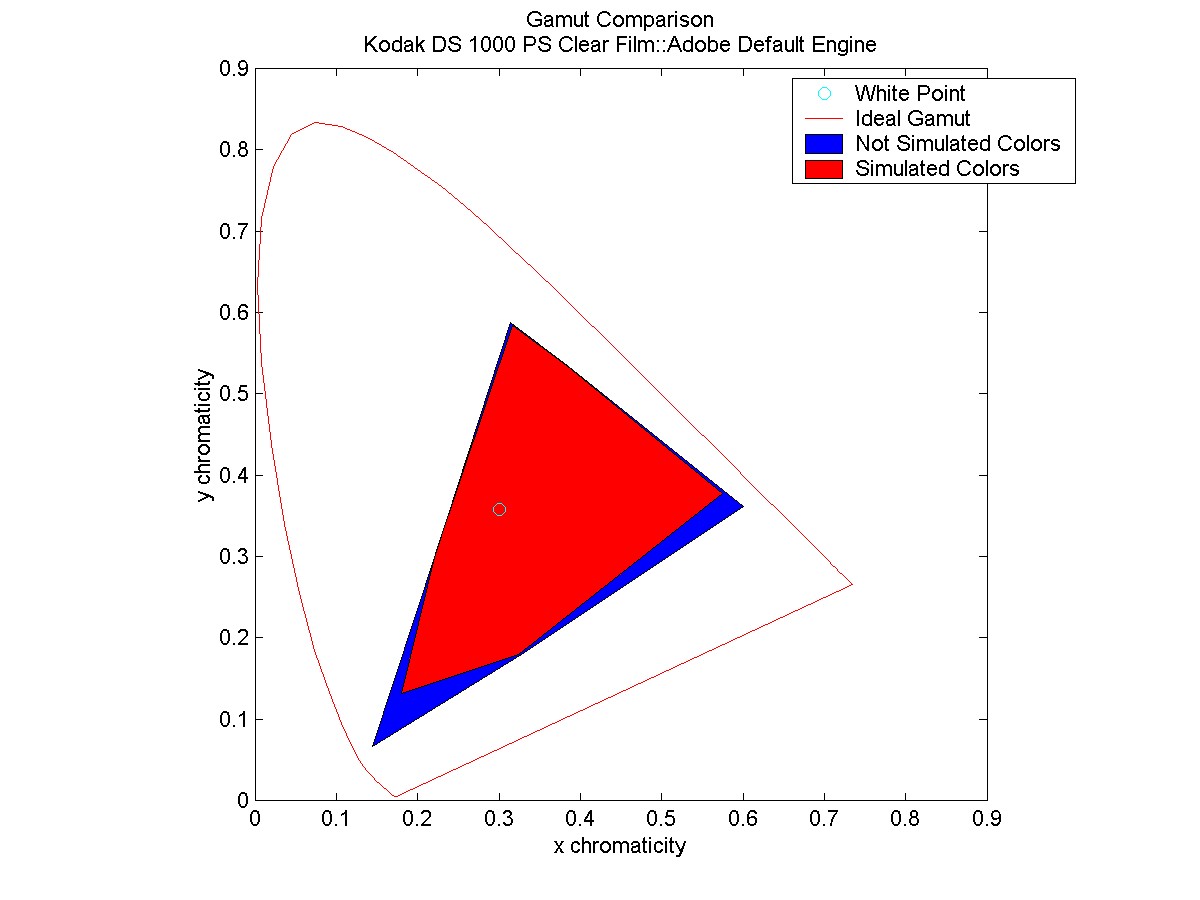
These plots depict the gamuts for the colors measured on the computer monitor with and without simulated printer colors for the Adobe Default Engine.
The thin red line is our 'ideal gamut' associated with the full color spectrum.