FURTHER STUDIES
Although the VASARI and MARC projects were the first of their kind to digitize image archiving, different parts of the project have been enhanced or researched further by commercial companies, universities, and other government funded agencies. A few examples are briefly described here.
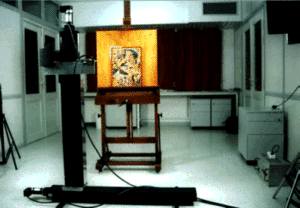
Alphatek, Ltd.(Greece) : EIKONA project
Commercial companies often attempt to reduce cost and increase the flexibility in order to allow more uses of the system. The EIKONA system provides a camera/illumination positioning system, a frame grabber, software to control the positioning, frame grabbing, and final mosaicing. Any CCD or infrared camera can be used with this system, as shown below.
The software used by EIKONA performs a variety of tasks. It can perform the following color transformations : RGB, XYZ, xyY, UVW, uvY, U*V*W*, SthetaW, L*a*b*, L*u*v*, YIQ, CMY, CMYK, HSI, HSV, HLS. It also supports aligning infra-red, visible, and x-ray images for comparison and analysis; and performs mosaicing for tiles collected in the frame grabbing mode. All software is versatile and allows plug-ins of other software; and manual, semi-automatic and automatic control. The software is simply an add-on to currently existing image-processing software.
A separate software tool is used for the archiving of the digital data. This is basically a data entry and search tool, where a form is filled out for each painting with all details of that painting. The data can thus be organized and retrieved by keywords from the form.
University of Thessolonia Research Project: ANTHIVOLON
This research program focused on several issues of digital archiving, one of which was different methods that can be applied to mosaicing the tiles captured from the image. The problem with mosaicing is that it’s a computation-intensive (and therefore slow) process. The methods researched by this group offer improvement in speed. There are three methods proposed: the spanning trees method, the subsets method, and the growing trees method. The growing tree method is decribed below.
The image is divided into a grid format. A spanning tree is built by connecting the nodes of the first row of the grid, and connecting the nodes of the first column of the grid. All remaining nodes compare the matching error with their upper and left neighbor. The edge which corresponds to the smallest error is selected. This is continued, spanning tree is built, eventually producing a mosaiced image.
Colorimetric analysis - Ecole Nationale Superieure des Telecommunications (J. Hardeberg et al.)
Just as a poem can be pulled apart and searched for such defining characteristics as iambic pentameter, so too, with the high resolution scanning capability, can paintings be analyzed. Each pixel in the painting image is projected into 3-dimensional CIELAB space. The resulting cloud of points can be divided into different regions of color - bright, dark, pastel, etc.,and analyzed in this manner. Hardeberg did an analysis of several different paintings and performed extractions of certain regions in the CIELAB for study. The characteristic formation of the CIELAB "cloud" is art in itself, and can tell much of the artist's unique way of using color. As an example, in one painting with a sky background, a part of CIELAB space is separated out to observe the formation of the sky. This cluster is composed of yellow-blue hues in inequal proportions, illustrating the chromatic adaptation phenomenom.
Simulation of Illuminant Changes - Ecole Nationale Superieure des Telecommunications (J. Hardeberg et. Al)
The VASARI project uses seven broadband filters to cover the spectrum in collecting digital images. This is used to obtain a reconstruction of tristimulus values. J. Hardeberg did further analysis to reconstruct the spectral reflectance curve using readily available filters as part developing a method of acquisition of a multispectral image. The solution presented was to select filters that, when multiplied with the illuminant and camera characteristics, span the same vector space as the reflectances that are to be acquired in the scan of the painting. In measuring the mean RMS filter to compare the actual and the reconstructed spectral images, the results were between 3.57 for three filters to 0.30 for 12 filters.
An application of the method for acquiring images developed in this paper is illuminant simulation. Two methods were presented and compared for simulating objects viewed under different illuminants: using CIELAB, and applying multispectral imaging techniques. The CIELAB method is to take the XYZ values relative to the XYZ values of the illuminant when making the transition for XYZ to CIELAB. The multispectral imaging technique uses the fact that each pixel contains information about the spectral reflectance imaged on it. This reconstructed spectra is used to calculate colorimetrically the XYZ tristimulus values of the surface imaged in this pixel and lit by the specified illuminant. The resulting values are used to estimate the CIELAB values under the particular luminant. In a test using five different illuminants, the multispectral imaging technique outperformed CIELAB in all cases except for using D65, which serves as a reference for the CIELAB model.
At this point, the VASARI and MARC projects use the D65 (daytime viewing) illuminant. Applications such as viewing the painting under candlelight conditions could cause this analysis of methods to be considered.
VISEUM project
Due to the huge file size to hold just one imaged painting, an application needed to be develop that would allow Internet access to the images with full ability to zoom into the painting, observe the high resolution, and not have to wait an extensive amount of time. It is therefore not reasonable to transmit the entire painting information to a client. The VISEUM system was developed as a solution to this. The entire image is held as a tiled pyramidal JPEG TIFF file at a server, and only the portions of the image that are requested are transmitted to the client. The client server communication is as follows. The client requests an area of the image. The server reads the requested tiles (which are stored in CIELAB format), decompresses them (in JPEG format), converts the LAB to RGB, compresses back to JPEG, and sends the data. The client decompresses the JPEG and can now view the image.
Another solution was offered where the client does the color processing. The server receives a requested area of the image from the client. It reads the tile, decompresses from JPEG format, and sends the LAB data uncompressed. The server receives the data, transforms the LAB to RGB, and displays the image.
In the future, the task of decompressing the JPEG LAB data may be moved to the client as well.