Psy 221 Project Report

Example Four
Click here to see the sub-sampled image.
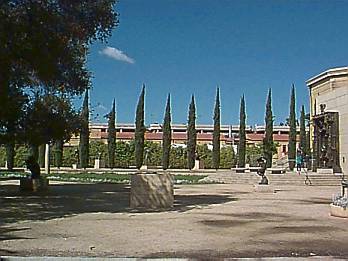
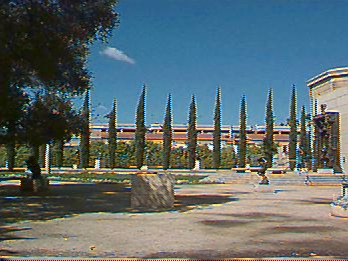
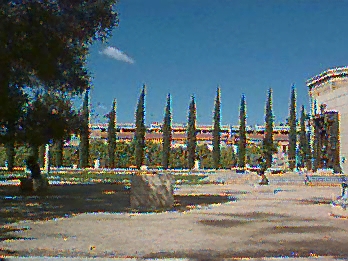
Images below are in the following order from left to right:
the original image, interpolated images using neighbor, median,
bilinear, random choice, and block matching algorithms.
The signal to noise ratios (SNRs) for the three color planes
are listed below for each algorithm.
|
| R-plane
| G-Plane
| B-plane
|
| neighbor
| 18.3379
| 21.5485
| 18.1273
|
| median
| 20.6556
| 26.4051
| 20.5231
|
| bilinear
| 20.7106
| 25.4221
| 20.5731
|
| random choice
| 18.2612
| 20.9871
| 18.3962
|
| block matching
| 18.3847
| 26.4051
| 18.4133
|