The light table in the ISE lab was used to maintain standard illumination for collecting data. However, there were several problems in using the table itself as a background, as it the reflective glare from it was disrupting our readings. The final solution to this problem was to use a matte black cardboard sheet over the table. While this did not eliminate the glare, it reduced it tremendously.
The spectral power distribution of each individual swatch was measured with the spectral radiometer. Each swatch was measured at the same location on the light table, and the illumination was kept constant. The downloaded files from this were processed through Matlab.
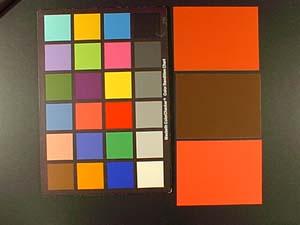
The original experimental design specified taking the digital camera pictures of swatches in a manner identical to the radiometer readings. However, it soon became clear that the Olympus camera was employing some color-balancing function that changed based on the color of the single swatch in the image area. Thus, we chose to include the MacBeth color checker alongside the color swatches to try and standardize the color balancing.
The gray scale swatches were measured individually (with the MacBeth always present.) However, given the volume of data, memory and processing time required, the color samples were measured three at a time. (The locations of the samples did not vary from picture to picture.) In every picture, an arbitary XY coordinate near the center of each swatch was used to center a 5x5 pixel grid over which the color of the swatch (in RGB values) was sampled.