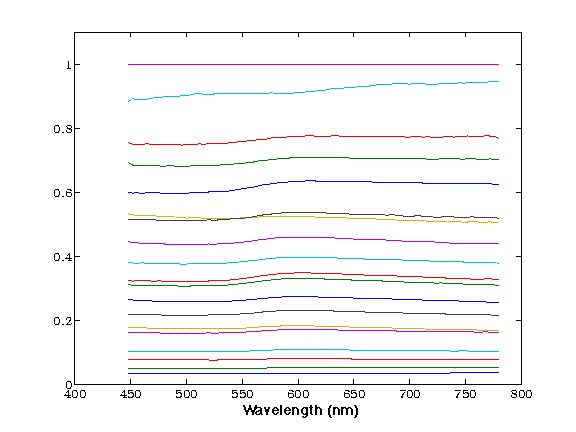
While comparing the spectral power distributions for the color swatches, it became obvious that all of the graphs exhibited a strong upward trend at the long wavelength end of the spectrum. This was attributed to the nature of the illumination (tungsten bulbs) used during data collection. In order to compensate, the spectral radiometer's output needed to be modified to reflect a flat white light rather than one with a strong yellow color bias. We made another assumption about the function of the camera, namely that the camera automatically compensated for different colored illumination using its own algorithms. The spectral radiometer however, had no such compensation. This can be seen most strikingly in the values measured for the gray scale.
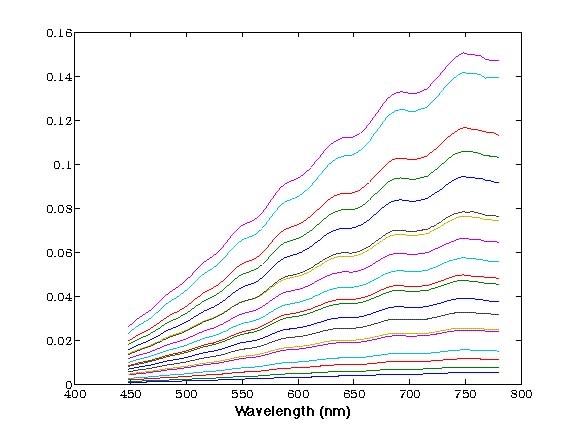
Since a white swatch should return a flat SPD curve,all of the samples were divided by the SPD values of the absolute white swatch. However, during the course of the calculation it was noticed that the low end of the SPD was showing a lot of inconsistency and noise. Attributing this difficulty to the near zero values associated with the lighting at the low wavelengths, and the radiometer's difficulty in reading wavelength information below 450nm, all of the SPD data was cut off below 450nm. This gave a complete set of gray scale measurements that were flat, and corrected values for the rest of the colors.